How might you enter a trend early on with near-impeccable timing and with some assurance that there’s likely to be enough momentum to sustain that trend? This is a question that market technician Gerald Appel faced early in his career. He believed that trends and momentum were critical to successful trading.
So, in the late 1970s, he developed an indicator designed to help identify trends, measure momentum, and generate signals at the point of a trend’s acceleration. It’s called the Moving Average Convergence-Divergence, or the MACD oscillator (pronounced Mac D).
What is the MACD and How Does It Work?
The MACD is one of the most known and widely used technical analysis indicators. A variation of the moving average crossover, the MACD is a trend-following momentum indicator that helps traders identify trends, measure their momentum, and recognize potential buy and sell signals. The entirety of the indicator is based on two components: the relationship between two exponential moving averages and a histogram.
How is the MACD Constructed?
The construction of the MACD indicator takes place in two steps:
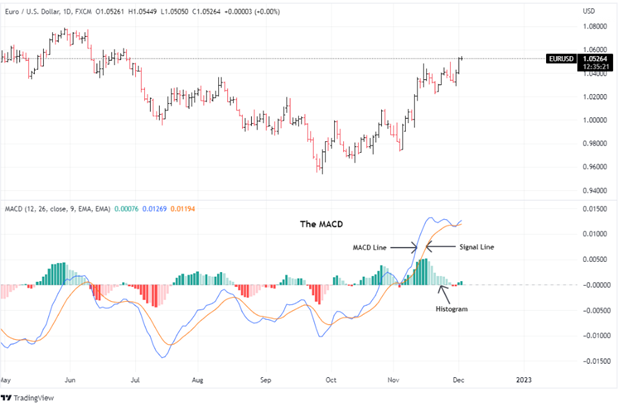
- Step 1: Subtract the 26-period exponential moving average (EMA) from the 12-period EMA. This will give us the MACD line. This calculation results in a value that oscillates above and below zero. The MACD line is also the faster moving average.
- Step 2: Construct a 9-day EMA of the MACD line calculated in Step 1. This will give us the signal line, which is plotted on top of the MACD line. Given that the signal line is a smoothing of the MACD line, it will be slower than the former.
The two lines, along with a histogram that shows the difference between them, are plotted below the price chart and constitute the MACD indicator.
What makes the MACD unique is that it provides two forms of critical data at once: trend identification, as evidenced by the use of the moving averages, and a measure of the momentum of price changes.
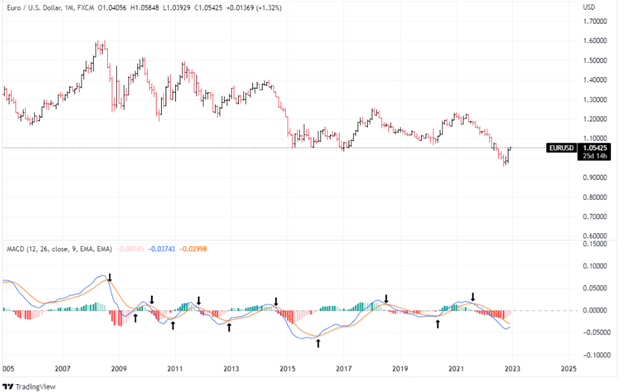
For long-term traders and investors, the most straightforward strategy to use is to buy when the MACD Line (Fast) crosses above the Signal Line (Slow), and to sell when the opposite happens. Looking at the monthly EURUSD chart below, we can see multiple instances of where a crossing between the two lines occur, and while we do have several whipsaws, on a long-term basis, when the trend takes shape, it has potential.
In order to minimize the small losses and not get stopped out of several trades, a trader can take only trades after the MACD line has moved excessively in one direction and moved away from the zero line, as was the case in late 2008 and in 2016 in the example below. In other words, stay away from a ranging market, lest you risk getting whipsawed.
This was a small overview of the history of the MACD, how to construct it and how to use it as a long-term strategy.
Gerald Appel mentioned a few tips in his book Technical Analysis Power Tools for Active Investors. Here are his main recommendations.
Divergences
When prices are trending opposite of the MACD indicator you have a “divergence.” MACD and price divergences may be the most reliable indicators that a reversal in price may be due.
MACD and Zero Line (Histogram):
When the MACD crosses from below to above the zero line, it’s a bullish signal; when the MACD crosses the zero line from above to below, it’s a bearish signal.
MACD and Signal Lines (Moving Average Crossovers)
When the MACD crosses the signal line from below, it’s traditionally bullish; when the MACD crosses below the signal line, it’s bearish.
Crossovers and the Zero Line:
The further a bullish crossover happens below the zero line, the stronger the signal; The further a bearish crossover happens above the zero line, the stronger the signal;
Stay away from trading ranges!
When price stops trending, MACD signals are no longer reliable.
The Bottom Line
The MACD is a flexible tool that can be interpreted various ways depending on your trading timeframe and strategy. This also makes the MACD somewhat subjective which, in turn, can generate confusion. Still, it’s an effective indicator when used in the right context. Experiment with the MACD and decide for yourself if any of its signals fit your trading approach. Like every other indicator, you can’t rely on it for “surefire” signals, but you can rely on it as an objective, albeit mechanical. reference for price action.
Please be aware that the content of this blog is based upon the opinions and research of GFF Brokers and its staff and should not be treated as trade recommendations. There is a substantial risk of loss in trading futures, options and forex. Past performance is not necessarily indicative of future results.
Disclaimer Regarding Hypothetical Performance Results: HYPOTHETICAL PERFORMANCE RESULTS HAVE MANY INHERENT LIMITATIONS, SOME OF WHICH ARE DESCRIBED BELOW. NO REPRESENTATION IS BEING MADE THAT ANY ACCOUNT WILL OR IS LIKELY TO ACHIEVE PROFITS OR LOSSES SIMILAR TO THOSE SHOWN. IN FACT, THERE ARE FREQUENTLY SHARP DIFFERENCES BETWEEN HYPOTHETICAL PERFORMANCE RESULTS AND THE ACTUAL RESULTS SUBSEQUENTLY ACHIEVED BY ANY PARTICULAR TRADING PROGRAM.
ONE OF THE LIMITATIONS OF HYPOTHETICAL PERFORMANCE RESULTS IS THAT THEY ARE GENERALLY PREPARED WITH THE BENEFIT OF HINDSIGHT. IN ADDITION, HYPOTHETICAL TRADING DOES NOT INVOLVE FINANCIAL RISK, AND NO HYPOTHETICAL TRADING RECORD CAN COMPLETELY ACCOUNT FOR THE IMPACT OF FINANCIAL RISK IN ACTUAL TRADING. FOR EXAMPLE, THE ABILITY TO WITHSTAND LOSSES OR TO ADHERE TO A PARTICULAR TRADING PROGRAM IN SPITE OF TRADING LOSSES ARE MATERIAL POINTS WHICH CAN ALSO ADVERSELY AFFECT ACTUAL TRADING RESULTS. THERE ARE NUMEROUS OTHER FACTORS RELATED TO THE MARKETS IN GENERAL OR TO THE IMPLEMENTATION OF ANY SPECIFIC TRADING PROGRAM WHICH CANNOT BE FULLY ACCOUNTED FOR IN THE PREPARATION OF HYPOTHETICAL PERFORMANCE RESULTS AND ALL OF WHICH CAN ADVERSELY AFFECT ACTUAL TRADING RESULTS.