Where is the Market Heading?
There are times when market action can be difficult to interpret. A scenario may appear in which all three directional conditions–uptrend, downtrend, and sideways market–are equally possible. If you’ve traded the markets for some time, you’ve probably come across such a scenario more than once.
Perhaps certain fundamental or technical conditions indicate that a given market should go in one direction or another. But that doesn’t mean that the market will follow the indication:
- What if your information is incomplete or flat out wrong?
- What if your information is correct but you interpreted it erroneously?
- What if your information and interpretation is correct but a random and unpredictable factor disrupted the markets?
Given all of the variables that can affect the markets, perhaps it’s best not to rely on “prediction” but rather on “principles” not only to identify potential opportunities, but to redirect our trades when our initial assessment is proven incorrect.
Should I Go Long or Short?
Remember that there are many trends within a trend. It all depends on the time frame on which you are focused. A trend in a 1-minute chart may not agree with a trend in a 60-minute chart or daily chart. You may come across situations in which some time frames reveal conflicting trends while other time frames reveal no trend at all.
So, if you are a swing trader whose trades may typically last from a few days to a week (and not much more than that), you might want to focus on the time frame that best contextualizes the opportunities you seek.
Once you are comfortable zooming in and out of your main time frame, only then can you better identify which trend(s) you will be using as your main reference point(s).
Key Principles to Determine Whether a Market is in an Uptrend or Downtrend
Let’s take a simple view of a trend, trend reversal, and sideways price action:
- Uptrend (U): higher highs and higher lows
- Downtrend (D): lower lows and lower highs
- Potential reversal (PR): lower lows are violated in an uptrend and higher highs are violated in a downtrend.
- Sideways or trading range (S): both lower lows and higher highs are continually violated or tested but without significant follow through in either direction.
The key to trading a potential or anticipated trend is to enter at or before a breakout while placing a stop loss at the point at which a trend (U or D) may become a potential reversal (PR) or a sideways market (S).
Let’s take a look at how this might apply to a historical Soybean futures chart (ZS):
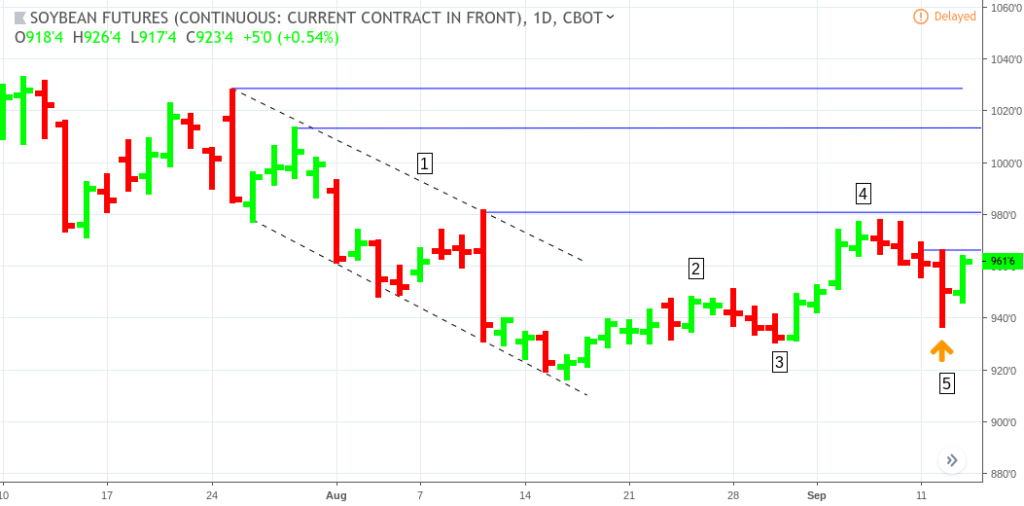
ZS (continuous contract) Daily Chart, July 10 to September 13, 2017
Let’s go back in time to September 13, 2017. Although we encourage paying attention to fundamentals even when trading technically, let’s suppose that you are unaware of the fundamental situation and this is all that you can see. What are you going to do?
It’s clear that the market has been in a short term downtrend (1), based on the principles we stated above. But we also saw that the after establishing a swing high at (2), price failed to break below the previous swing low at (3).
If price can’t move forward to establish a ”lower low” in a downtrend, then the trend is in question. Instead, price broke above the most recently established swing high (2) and established a new swing high at (4).
Now, on Sept. 13, we see that price might have established a new and “higher” swing low at (5). Remember that higher highs and higher lows indicates a possible uptrend.
If your bias is toward the upside, even for the short term, then perhaps you can see the opportunity.
- Placing a buy stop above the lowest “local” low (5) may be a reasonable entry point.
- A short term target is at (4), the second-to-the-last swing high point.
- Another longer-term target is at the blue line above (4) which is the July 28 high.
- The last target, which might require a longer-term uptrend is at the top blue line, the July 25 high.
Again, we cannot tell whether the current upward movement constitutes a trend reversal toward the upside or a potential range, should price fail to move above (4). But as a swing trader, you decided to exploit this potential opportunity.
Let’s see what might have happened:
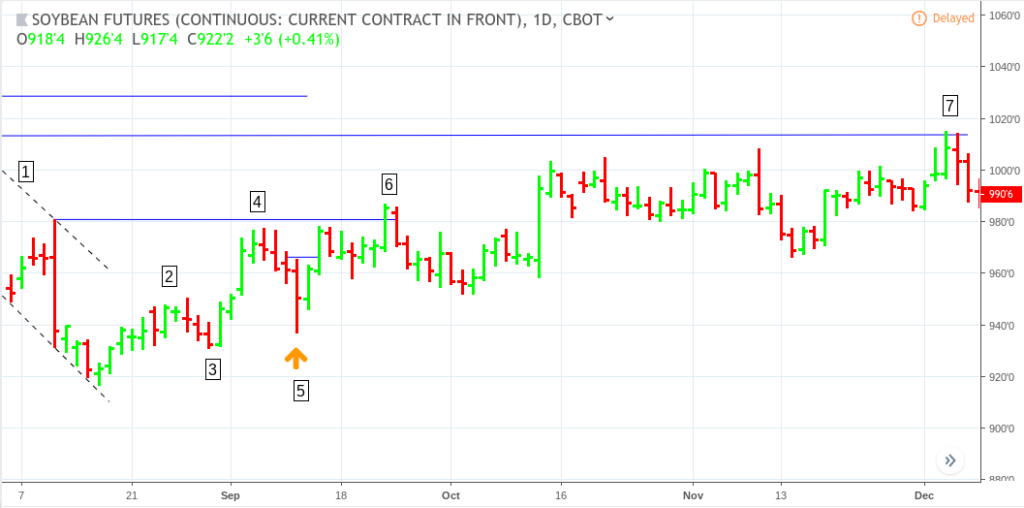
ZS (continuous contract) Daily Chart, August 4 to December 7, 2017
Your short-term target was hit seven sessions later at (6). If you held your position for the longer-term target, you would have had to wait almost three months for your target to be reached at (7). The highest profit target (top blue line), though not illustrated in the chart above, was ultimately never reached.
The price action from (2 – 6) was that of an uptrend transforming into a trading range. If you had followed the basic trend identification principles described near the top of this article, the market would have given you plenty of time to determine that price was in a consolidation phase.
There are plenty of other ways to help determine the potential trend of a market. This is just one of them.
If you do not adhere to a method for identifying trends, then you run the risk of forecasting the markets with little to no reference points. Without reference points, it may be harder to tell whether your estimation may be closer to right or wrong. And without this basic sense of guidance, you may not know when to close a trade, hold a trade, or redirect your trade when necessary.
Please be aware that the content of this blog is based upon the opinions and research of GFF Brokers and its staff and should not be treated as trade recommendations. There is a substantial risk of loss in trading futures, options and forex. Past performance is not necessarily indicative of future results.
Be advised that there are instances in which stop losses may not trigger. In cases where the market is illiquid–either no buyers or no sellers–or in cases of electronic disruptions, stop losses can fail. And although stop losses can be considered a risk management (loss management) strategy, their function can never be completely guaranteed.
Disclaimer Regarding Hypothetical Performance Results: HYPOTHETICAL PERFORMANCE RESULTS HAVE MANY INHERENT LIMITATIONS, SOME OF WHICH ARE DESCRIBED BELOW. NO REPRESENTATION IS BEING MADE THAT ANY ACCOUNT WILL OR IS LIKELY TO ACHIEVE PROFITS OR LOSSES SIMILAR TO THOSE SHOWN. IN FACT, THERE ARE FREQUENTLY SHARP DIFFERENCES BETWEEN HYPOTHETICAL PERFORMANCE RESULTS AND THE ACTUAL RESULTS SUBSEQUENTLY ACHIEVED BY ANY PARTICULAR TRADING PROGRAM.
ONE OF THE LIMITATIONS OF HYPOTHETICAL PERFORMANCE RESULTS IS THAT THEY ARE GENERALLY PREPARED WITH THE BENEFIT OF HINDSIGHT. IN ADDITION, HYPOTHETICAL TRADING DOES NOT INVOLVE FINANCIAL RISK, AND NO HYPOTHETICAL TRADING RECORD CAN COMPLETELY ACCOUNT FOR THE IMPACT OF FINANCIAL RISK IN ACTUAL TRADING. FOR EXAMPLE, THE ABILITY TO WITHSTAND LOSSES OR TO ADHERE TO A PARTICULAR TRADING PROGRAM IN SPITE OF TRADING LOSSES ARE MATERIAL POINTS WHICH CAN ALSO ADVERSELY AFFECT ACTUAL TRADING RESULTS. THERE ARE NUMEROUS OTHER FACTORS RELATED TO THE MARKETS IN GENERAL OR TO THE IMPLEMENTATION OF ANY SPECIFIC TRADING PROGRAM WHICH CANNOT BE FULLY ACCOUNTED FOR IN THE PREPARATION OF HYPOTHETICAL PERFORMANCE RESULTS AND ALL OF WHICH CAN ADVERSELY AFFECT ACTUAL TRADING RESULTS.