For some traders, market volatility can be considered favorable. After all, when market conditions present you with large powerful swings in either direction, you have the opportunity to ride the swing whether long or short.
It’s when volatility presents itself without any sense of directional movement that situations can get tricky. You may not be able to trade, as no immediate trend presents itself. But a worse situation may be getting into a trade right when price begins to move in a choppy, sideways motion.
Here’s a question: how soon might you be able to identify when a trend is going to move sideways?
The answer is that there are basic price-action principles you can use that indicate when a trend “might” be hinting at moving sideways. Remember, this is not the same as prediction. As no trader can predict whether price will be trending up or down, no trader can predict when price will begin fluctuating within a limited range.
Despite our lack of future-telling capacity, there are techniques that can help you identify or anticipate a sideways market. These techniques are reference points, designed less to be accurate and correct, and more to be adaptive, flexible, and relatively actionable.
Sideways markets are generally categorized into two types: consolidation or trading range
You may ask: “Is the market in consolidation or in a trading range?” It all depends on the time frame, as time may often dictate the relative scale. As you can see in the weekly chart below, the orange rectangle illustrates a wide trading range, while the smaller rectangle details a consolidation (if you were trading on a smaller time-frame, say the 15-minute chart, this consolidation may appear as a trading range, one surrounding even smaller instances of “consolidation” on the minute level).
XAUUSD June 13, 2011 to April 8, 2013
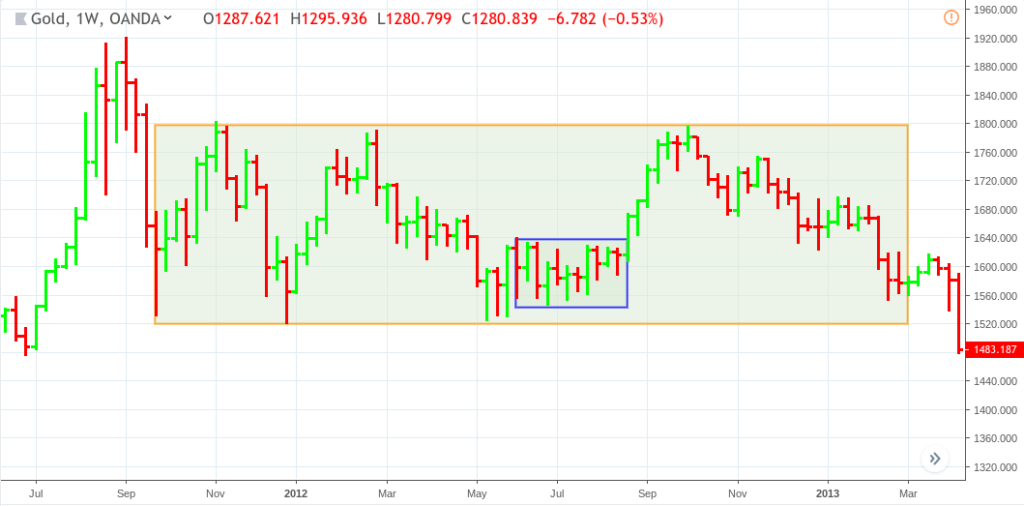
One interpretation applied to both forms of sideways movements is that in such conditions, neither the bulls nor the bears can take control of the market. The market is in a period of undecidability, a tug-of-war-like situation in which price is unable to move beyond support or resistance.
Here are a few principles to help identify the potential onset of a sideways market
First, it’s important to note that trends are specific to time frame. In other words, different time frames can have different trends. So if you are seeking to trade a trend, it helps to know which time frame best contextualizes the trend you are following.
- An uptrend is characterized by consecutive higher highs and higher lows.
- A downtrend is characterized by consecutive lower lows and lower highs.
- Any discontinuation of either pattern may indicate a potential shift toward a more consolidated or ranging market, or a potential reversal.
Let’s see how these principles apply to real market examples.
Crude Oil Futures (continuous contract) Hourly Chart – Nov, 19 to Dec 18, 2018
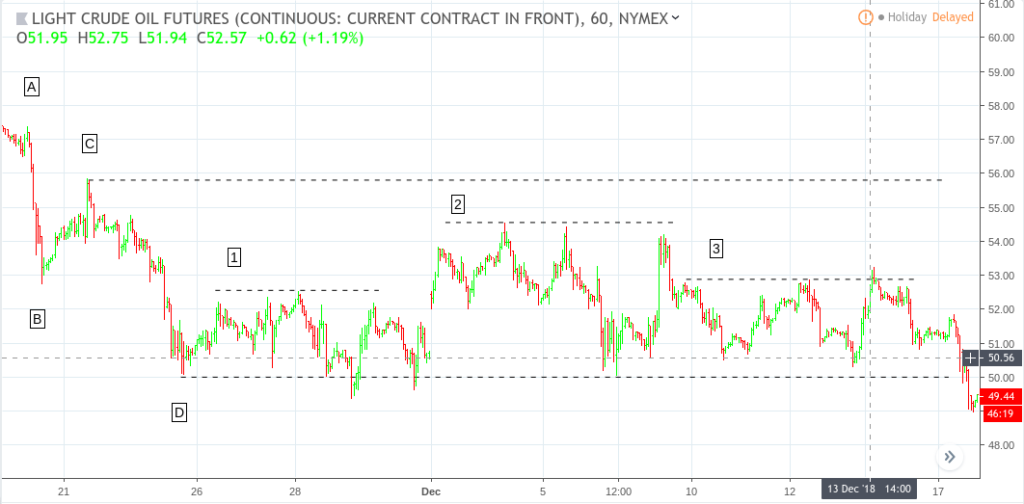
From November 18 through Nov 25, we see a downtrend formation consisting of a swing high (A) and swing low (B) followed by a lower swing high (C) and a lower swing low (D).
With our bias positioned toward the downside, we expect another retracement (swing high) followed by a break below (D) toward the establishment of another swing low. But that’s not what happens.
After a retracement at (1), we get two tests of (D), both of which failed to break lower.
Note: This is the first indication that a change or a reversal might be taking place.
Bouncing back from (D), price also fails to break above the previous swing high (resistance) at (C) instead establishing a lower resistance level at (2).
Note: This second failure in a directional breakout may strongly indicate that neither a trend continuation nor a reversal toward the upside may be taking place.
Price then moves downward to test support at (D) once again followed by a failure to break above resistance at (3) which is very similar to the price level at (1). Although by this point, you might be aware that the market is moving sideways, the first indications that such a market condition might be taking place would have been at the failure to break below (D) and the formation of resistance levels at (1) and (2).
What Might a Trader Have Done In This Situation?
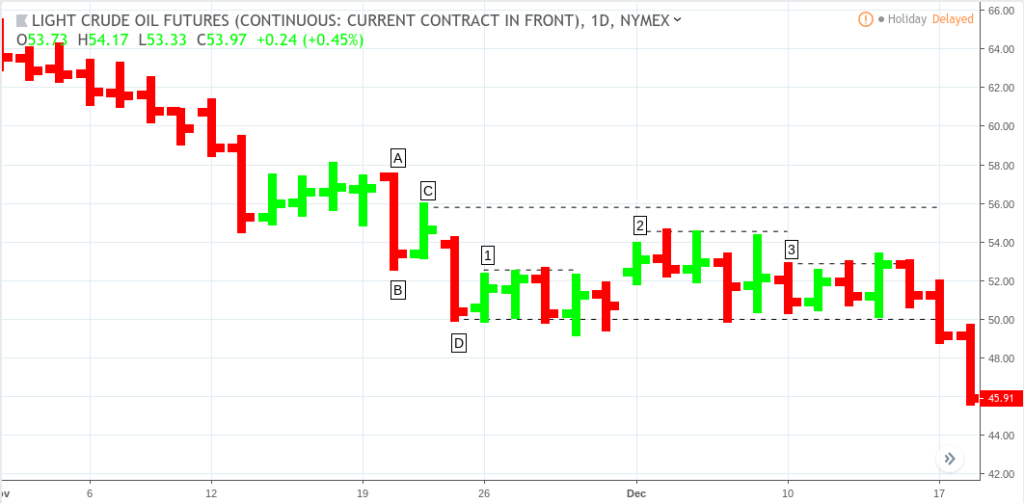
Let’s suppose that your intention is to follow the current trend as seen in the 60-minute (and not to trade against it). You might have jumped to the daily chart which would have given you a different perspective: the consecutive swing highs and lows (A), (B), (C) and (D) would have looked like minor movements. Swing highs at either (A) or (C) might have served as potential breakout zones toward the upside, while (D) might still have served as a favorable swing low level.
Crude Oil Futures (continuous contract) Daily Chart – Nov, 1 to Dec 18, 2018
The above charts aim to show how a simple price-action based approach can serve as an adaptive means to assess, anticipate, and redirect trend bias without having to rely on any measures geared toward prediction or accuracy.
There is no way to predict the future with total accuracy. Instead, it may be better to be establish clear points of reference that are adaptable and direct enough to anticipate price movements while giving you enough flexibility to “adjust” or “correct” your trades as real-time market conditions unfold.
Please be aware that the content of this blog is based upon the opinions and research of GFF Brokers and its staff and should not be treated as trade recommendations. There is a substantial risk of loss in trading futures, options and forex. Past performance is not necessarily indicative of future results.
HYPOTHETICAL PERFORMANCE RESULTS HAVE MANY INHERENT LIMITATIONS, SOME OF WHICH ARE DESCRIBED BELOW. NO REPRESENTATION IS BEING MADE THAT ANY ACCOUNT WILL OR IS LIKELY TO ACHIEVE PROFITS OR LOSSES SIMILAR TO THOSE SHOWN. IN FACT, THERE ARE FREQUENTLY SHARP DIFFERENCES BETWEEN HYPOTHETICAL PERFORMANCE RESULTS AND THE ACTUAL RESULTS SUBSEQUENTLY ACHIEVED BY ANY PARTICULAR TRADING PROGRAM.
ONE OF THE LIMITATIONS OF HYPOTHETICAL PERFORMANCE RESULTS IS THAT THEY ARE GENERALLY PREPARED WITH THE BENEFIT OF HINDSIGHT. IN ADDITION, HYPOTHETICAL TRADING DOES NOT INVOLVE FINANCIAL RISK, AND NO HYPOTHETICAL TRADING RECORD CAN COMPLETELY ACCOUNT FOR THE IMPACT OF FINANCIAL RISK IN ACTUAL TRADING. FOR EXAMPLE, THE ABILITY TO WITHSTAND LOSSES OR TO ADHERE TO A PARTICULAR TRADING PROGRAM IN SPITE OF TRADING LOSSES ARE MATERIAL POINTS WHICH CAN ALSO ADVERSELY AFFECT ACTUAL TRADING RESULTS. THERE ARE NUMEROUS OTHER FACTORS RELATED TO THE MARKETS IN GENERAL OR TO THE IMPLEMENTATION OF ANY SPECIFIC TRADING PROGRAM WHICH CANNOT BE FULLY ACCOUNTED FOR IN THE PREPARATION OF HYPOTHETICAL PERFORMANCE RESULTS AND ALL OF WHICH CAN ADVERSELY AFFECT ACTUAL TRADING RESULTS.