In last week’s post, we covered the basic mechanics of an order book as viewed in a DOM. The only setback in following order flow from a DOM is that once the order has been filled, the numbers change and you have no record of how many contracts were bought and sold.
If you are looking to take use order flow to inform your trading, then you need a record showing how many contracts were bought and sold at a given price. Otherwise, you’d have no way of keeping track of order flow and, more importantly, identifying where trade imbalances took place.
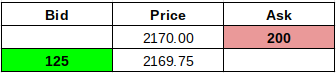
For instance, let’s imagine a hypothetical scenario were a trader is willing to sell 200 ES contracts at the ask (a sell limit order) at the price of 2170.00. Another trader is willing to buy 125 contracts at the bid at 2169.75.
It would look like this:
Then suddenly, a buyer comes in and snatches up those 200 contracts at the ask.
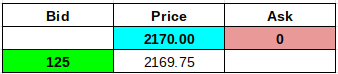
The ask is now at zero (someone purchased all of it) and the “last trade” is now at 2170.00.
Buying and selling happens quite frequently, but were there more contracts bought or sold over a given time frame? If there were more bought than sold, then that might indicate a bullish bias. If more contracts were sold rather than bought, then that might indicate a bearish bias.
What were the bigger purchases that took place? With a DOM, there is no memory or record. But you need that data if you plan on using order flow to inform your decisions. Enter order flow software, popularly referred to as “footprints.”
Using Footprint Profile to Interpret Order Flow
A Footprint profile is a volume histogram chart that records how many bids and asks were filled. With a footprint chart, you read numbers diagonally.
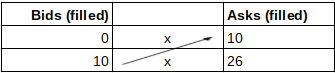
The above footprint shows that 10 bids were filled and (diagonally) 10 asks were filled. This is a balanced trade, a 100% match – a buyer wanted 10 contracts, and a seller sold 10 contracts.
Now let’s look at a different footprint below.
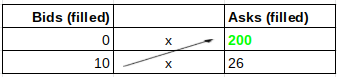
The above footprint shows that there were 200 contracts bought (highlighted green) at the asking price while only 10 contracts were sold at the bidding price, during a specified time period (depending on a trader’s set chart timeframe).
200 contracts bought versus 10 sold. That’s 2,000% more contracts bought than sold. Let’s suppose that we consider any market order exceeding 300% to be an imbalance – there is no standard for this figure and it varies according to the trader. 2,000% is well above the 300%, huge by most any standard. From an order flow perspective, this may indicate bullishness, whether the price went up or down as a result. It may mean that many buyers jumped in. If price went down, and trade imbalances still indicate stronger “buying pressure,” then the order flow may present an opportune moment to go long.
Now, we have demonstrated the importance an footprints related to order flow strategy. It’s the best way to get a big picture view of trade imbalances.
Let’s take this a step further.
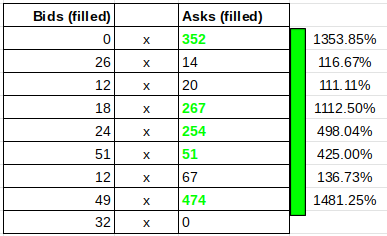
Let’s review the footprint above starting with the top column. 352 contracts were purchased while only 26 were sold. That’s a 1353.85% difference, again well above the 300% standard we decided on. More buys than sells. All of the imbalances (over 300%) are highlighted green, indicating that buying pressure > selling pressure.
In a reverse (bearish) scenario, you may come across a chart similar to the following.
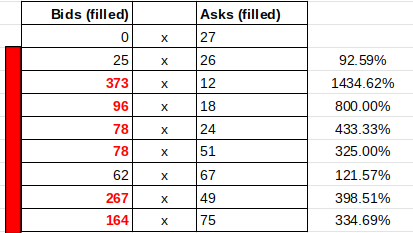
Again, note the buy vs sell imbalances.
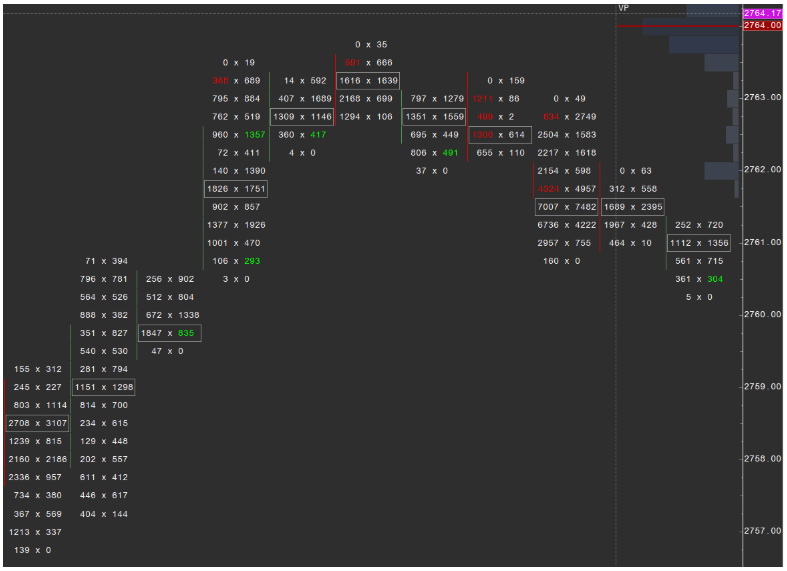
On a larger scale (this example from the MarketDelta platform), one version of a footprint profile can look like this:
The main takeaway is that in order to use order flow to inform your trades, you may need to identify and chart the imbalances between buys and sells. And one effective way to accomplish that is to have a histogram that charts the volume behind these purchases. Without an adequate record of trade order flow, you may not be able to take full advantage of order flow data.
Please be aware that the content of this blog is based upon the opinions and research of GFF Brokers and its staff and should not be treated as trade recommendations. There is a substantial risk of loss in trading futures, options and forex. Past performance is not necessarily indicative of future results.
Disclaimer Regarding Hypothetical Performance Results: HYPOTHETICAL PERFORMANCE RESULTS HAVE MANY INHERENT LIMITATIONS, SOME OF WHICH ARE DESCRIBED BELOW. NO REPRESENTATION IS BEING MADE THAT ANY ACCOUNT WILL OR IS LIKELY TO ACHIEVE PROFITS OR LOSSES SIMILAR TO THOSE SHOWN. IN FACT, THERE ARE FREQUENTLY SHARP DIFFERENCES BETWEEN HYPOTHETICAL PERFORMANCE RESULTS AND THE ACTUAL RESULTS SUBSEQUENTLY ACHIEVED BY ANY PARTICULAR TRADING PROGRAM.
ONE OF THE LIMITATIONS OF HYPOTHETICAL PERFORMANCE RESULTS IS THAT THEY ARE GENERALLY PREPARED WITH THE BENEFIT OF HINDSIGHT. IN ADDITION, HYPOTHETICAL TRADING DOES NOT INVOLVE FINANCIAL RISK, AND NO HYPOTHETICAL TRADING RECORD CAN COMPLETELY ACCOUNT FOR THE IMPACT OF FINANCIAL RISK IN ACTUAL TRADING. FOR EXAMPLE, THE ABILITY TO WITHSTAND LOSSES OR TO ADHERE TO A PARTICULAR TRADING PROGRAM IN SPITE OF TRADING LOSSES ARE MATERIAL POINTS WHICH CAN ALSO ADVERSELY AFFECT ACTUAL TRADING RESULTS. THERE ARE NUMEROUS OTHER FACTORS RELATED TO THE MARKETS IN GENERAL OR TO THE IMPLEMENTATION OF ANY SPECIFIC TRADING PROGRAM WHICH CANNOT BE FULLY ACCOUNTED FOR IN THE PREPARATION OF HYPOTHETICAL PERFORMANCE RESULTS AND ALL OF WHICH CAN ADVERSELY AFFECT ACTUAL TRADING RESULTS.