Over the last few years or so, “order flow” has become something of a new buzzword in retail trading circles. It’s almost as if there’s an air of mystery surrounding the idea, a code that (once deciphered) might give one trader a significant “edge” over another.
The irony in all this is that order flow is one of the oldest, most basic, and almost primal functions of the market. There are traders who are willing to buy or sell at a given price limit, as in “I want to buy or sell at this price or better,” and then, there are traders who are willing to cross that limit, buying or selling at the best available price. That’s order flow in a nutshell.
If order flow is mysterious, it’s because its nuances are not easily understood, or for those who do understand it, the data is not always accessible, save for special software and data feed. But regardless of whatever tools you may have to decipher and interpret order flow, you can never anticipate the buyers and sellers who jump in “out of nowhere” at a given moment, making the market environment more dynamic.
In this this first installment of our series on Order Flow, we’ll cover the basics of order flow and its practical use as a possible market movement indicator.
What is Order Flow?
Order flow is essentially the interplay between two types of orders: 1) limit orders, most of which are visible in the order book, a.k.a. Depth of Market, DOM, price ladders, etc.; and, 2) market orders, which aim to buy or sell at the “best ask” or “best bid” respectively. These you can’t see beforehand.
This interplay between limit and market orders is one of the main forces that drives price movement. To get a better understanding of this process, lets explore how the order book works.
The Order Book aka DOM (Depth of Market)
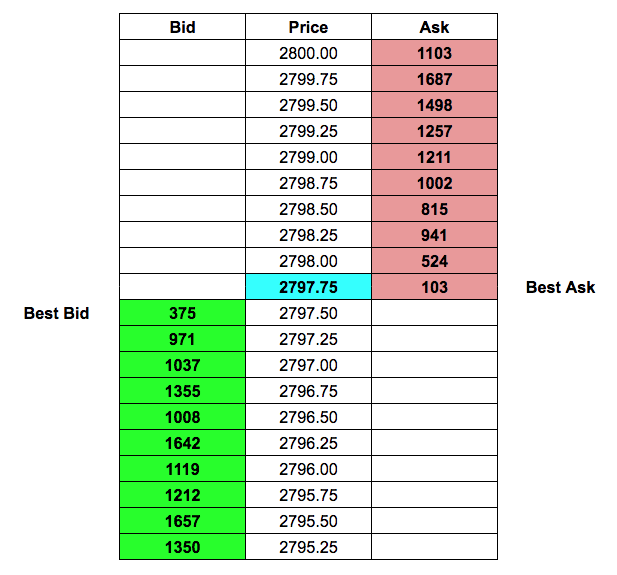
Depth of Market data is also known as the order book, since it shows the pending orders for a particular market. Below is a hypothetical rendering of the DOM for the E-Mini S&P 500 futures.

Here’s what you need to know:
- The middle column shows prices.
- There are 10 bid levels and 10 sell levels.
- The “best bid” and “best ask” are those nearest one another.
- All of these orders are limit orders, meaning that traders on the bid side want to buy at the price corresponding to their price ladder or better (lower); the reverse is true for sellers.
- IMPORTANT: these orders will likely not get filled unless a buyer is willing to buy at the ask or a seller is willing to sell at the bid.
Enter the market order.

A market order means “fill at the best bid (if you’re selling) or ask (if you’re buying).” It’s another way of saying “get me in or out of the market NOW.”
Notice the price highlighted in blue? That’s the last trade and current price. Note that the last trade took place on the “best ask” side, meaning a buyer stepped in with a market order, and that order was matched to the best ask (or best sell limit order).
This interplay between a limit order and market order forms the basis of order flow.
But, how does order flow move prices?
How Order Flow Moves Prices
Imagine working as a trader for a large institution, like a major alternative investments fund. To satisfy your fund’s allocation requirements, you need to purchase a whopping 10,000 ES contracts at the market.
Given that you need to fulfill your fund’s allocation ASAP, you decide to buy it all at once, knowing that your actions are likely to move price as soon as you hit all of those asks.
So you place a large market order of 10,000 ES contracts–all of which will get matched to the asks on the screen. In slow motion, here’s what may happen.
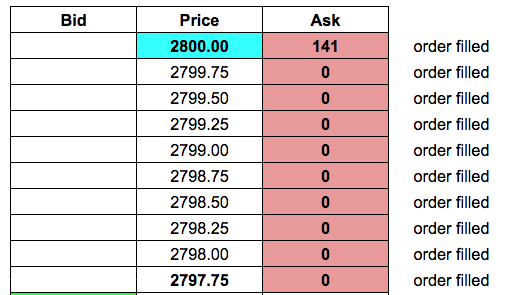
You bought every ask, moving the last trade and current price to 2800.00 from its original 2792.75 position. You were basically the market’s “whale” at the moment.
Trade Imbalances
Another important takeaway from this is that you caused massive trade imbalances in the process. How so?
If a seller places an ask of 100 contracts and a buyer fills it with a market buy order of 100 contracts, then that’s a balanced trade–you want 100 contracts, and I (as seller) have 100 for you.
But the hypothetical trade we just placed was highly unbalanced. Let’s take a look at it again.
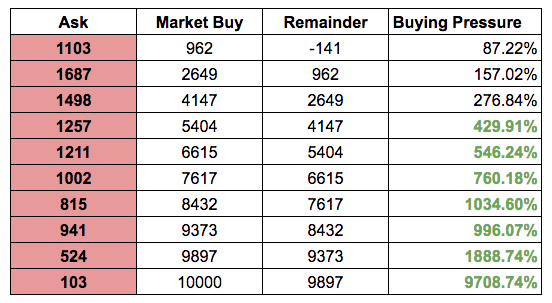
Your order of 10,000 contracts was 9,708.74% greater than the available number of contracts at the best ask. Once filled, you still had 9,897 left to be filled, but only 524 contracts available at the ask, your market order exceeding available contracts by 1,888.74%.
Let’s suppose that we consider any market order exceeding 300% to be an imbalance – there is no standard for this figure and it varies according to the trader. In this case, all of the highlighted percentages in green indicate an imbalance.
And how might knowing this help you as a trader?
If you can identify the trade imbalances, you might – that is “might” – be able to get a clearer indication of the bullish or bearish bias of a given instrument.
And we’ll cover that in the next installment.
Please be aware that the content of this blog is based upon the opinions and research of GFF Brokers and its staff and should not be treated as trade recommendations. There is a substantial risk of loss in trading futures, options and forex. Past performance is not necessarily indicative of future results.