There’s a lot that happens in the first five minutes of the NYSE market opening. This is when large funds and financial institutions place large orders to stake a position (long or short) or liquidate positions. It’s a torrent of buy and sell orders issued by large players pursuing a longer-term goal.
Arguably, it’s no place for a day trader aiming to profit by a few ticks or points. Not only does the first five minutes represent a condensed collision of longer-term strategies jockeying for position on high volume, but it usually takes at least half an hour for directionality to become apparent. And most of the time, a major reversal takes place within the hour, making the first five minutes a critical setup for most day traders looking to exploit the first hour of trading.
Anticipating a reversal following the first five minutes of trading
Taking a note from Linda Bradford Raschke’s work, the first five minutes can present trades with an almost-reliable setup. There’s an explosion of activity, a short-term trend, and then a reversal that continues for most of the day. As a day trader, you may want to try to capture a portion of that reversal. But how might you do it?
One tool you can use on a 5-minute chart is Bollinger Bands. Here’s one potential way to trade the setup.
Trading the reversal using Bollinger Bands
First, plot a standard Bollinger Band on a 5-minute chart of an ES (or MES) contract.
- Sit it out for the first five minutes.
- One price breaks beyond one side of the band, wait for a candle to close within the bands.
- (Short) – If the initial trend is bullish (and you’re trading a bearish reversal), place a sell stop a few ticks below the low of the candle that closed within the bands. Place a stop loss a few ticks above that highest swing high.
(Long) – If the initial trend is bearish (and you’re trading a bullish reversal), place a buy stop a few ticks above the high of the candle that closed within the bands. Place a stop loss a few ticks below that lowest swing low. - Measure the height of the candle and place a limit order (to take profit) that represents a 75% to 100% extension of the candle’s height.
Let’s demonstrate this using historical market scenarios.
EXAMPLE 1: MES – July 11, 2022
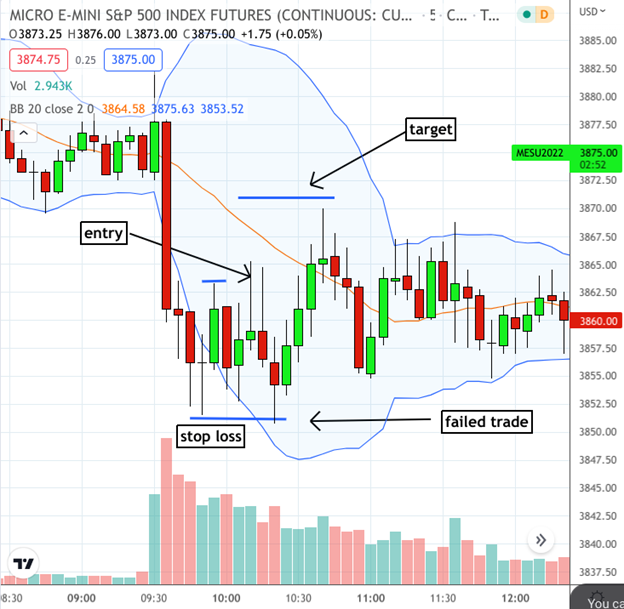
Source: TradingView
The above demonstrates a failed trade as it gets stopped out before reaching the target.
EXAMPLE 2: MES – July 06, 2022
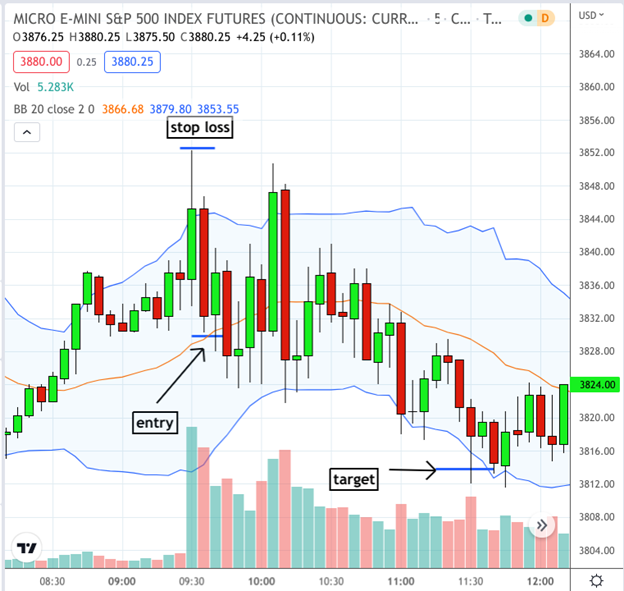
Source: TradingView
The above is an example of a favorable trade, while Example 1 illustrated a failed trade. As with every setup, be prepared for any trade to fail, meaning use a sound risk management strategy to minimize your losses.
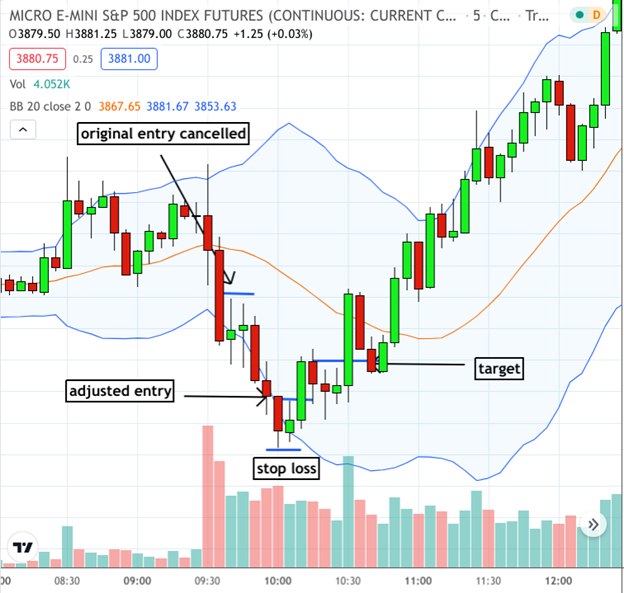
MES – June 30, 2022
If you’re following the rules, you’ll see that the entry signal in the example below was adjusted to accommodate for a new low point.
You’ll also notice that the height of the entry candle was not very substantial, meaning you would have missed out on most of the trend.
If you opened two positions, you could have let the second position continue riding the trend. But again, if you open two positions and the market works against you, well, that’s the risk you take.
Now that we have reviewed a few trade illustrations, let’s talk about risks.
What are the potential advantages and risks?
The biggest potential advantage of this trade is that it’s a daily market event. Every market opening presents an opportunity to seek out and trade a reversal. This means every market day presents a chance to trade at a predictable moment.
The big risk is that moves at the market opening can be chaotic, especially when its fueled by conflicting interpretations of economic reports, many of which are released 8:30 am ET. This means that any trade of this kind is vulnerable to getting stopped out, even if the market eventually moves in your favor in the minutes or hours to come.
The bottom line
Trading the opening minutes of the NYSE open is not for the feint of heart. But for those who are willing to join the fray, hopefully with a solid money management strategy, it’s an opportunity that’s always there every 9:30 am ET.
Please be aware that the content of this blog is based upon the opinions and research of GFF Brokers and its staff and should not be treated as trade recommendations. There is a substantial risk of loss in trading futures, options and forex. Past performance is not necessarily indicative of future results.
Be advised that there are instances in which stop losses may not trigger. In cases where the market is illiquid–either no buyers or no sellers–or in cases of electronic disruptions, stop losses can fail. And although stop losses can be considered a risk management (loss management) strategy, their function can never be completely guaranteed.
Disclaimer Regarding Hypothetical Performance Results: HYPOTHETICAL PERFORMANCE RESULTS HAVE MANY INHERENT LIMITATIONS, SOME OF WHICH ARE DESCRIBED BELOW. NO REPRESENTATION IS BEING MADE THAT ANY ACCOUNT WILL OR IS LIKELY TO ACHIEVE PROFITS OR LOSSES SIMILAR TO THOSE SHOWN. IN FACT, THERE ARE FREQUENTLY SHARP DIFFERENCES BETWEEN HYPOTHETICAL PERFORMANCE RESULTS AND THE ACTUAL RESULTS SUBSEQUENTLY ACHIEVED BY ANY PARTICULAR TRADING PROGRAM.
ONE OF THE LIMITATIONS OF HYPOTHETICAL PERFORMANCE RESULTS IS THAT THEY ARE GENERALLY PREPARED WITH THE BENEFIT OF HINDSIGHT. IN ADDITION, HYPOTHETICAL TRADING DOES NOT INVOLVE FINANCIAL RISK, AND NO HYPOTHETICAL TRADING RECORD CAN COMPLETELY ACCOUNT FOR THE IMPACT OF FINANCIAL RISK IN ACTUAL TRADING. FOR EXAMPLE, THE ABILITY TO WITHSTAND LOSSES OR TO ADHERE TO A PARTICULAR TRADING PROGRAM IN SPITE OF TRADING LOSSES ARE MATERIAL POINTS WHICH CAN ALSO ADVERSELY AFFECT ACTUAL TRADING RESULTS. THERE ARE NUMEROUS OTHER FACTORS RELATED TO THE MARKETS IN GENERAL OR TO THE IMPLEMENTATION OF ANY SPECIFIC TRADING PROGRAM WHICH CANNOT BE FULLY ACCOUNTED FOR IN THE PREPARATION OF HYPOTHETICAL PERFORMANCE RESULTS AND ALL OF WHICH CAN ADVERSELY AFFECT ACTUAL TRADING RESULTS.