When is the price of an asset too high or too low to buy or sell? That’s a question that traders ask every day, and they have various tools and approaches to help them determine the “right price” for a particular trade.
When it comes to short-term trading, particularly for scalpers and day traders using high leverage, this question becomes all the more relevant, as placing a trade at the wrong price and time can result in a sizable loss.
But what is the “wrong” price? Price may be a neutral thing; favorable or unfavorable depending on your time frame or strategy. To a scalper aiming for a 5-point profit, the price of X may be too high to go long. Whereas for a swing trader seeking a 100-point profit, it may not matter much.
For a scalper, however, the wrong price may be any price that goes against a crowd of institutional trades, such as mutual funds. Swimming against the financial whales is a “no-no.” Likewise, swimming in their direction may help your trade as their large amounts of capital can help swing price towards your direction.
But how might you spot which direction a “whale” may be swimming? This is where the Volume Weighted Moving Average (VWAP) comes in handy.
What VWAP May Offer in Addition to Price Interpretation
The VWAP indicator is designed to show the “average price” of an asset based on volume and price. In other words, it aims to show when a price is relatively undervalued or overvalued based on its calculations.
Now why is this important? Let’s compare a day trader to a mutual fund manager.
The day trader is attempting to profit from a short-term move, whether up or down. Although day traders can sometimes use high leverage to multiply their trading capital, rarely do they have enough capital to move markets.
Most mutual fund managers, on the other hand, have enough capital resources to move markets, if they’re not careful. So, when they seek to open a full position (or sell a full position), they have to buy (or sell) in small chunks, several times in a given session so as to not obfuscate the market too much. In other words, they’re still likely to move markets given the sheer size of their positions, but most managers will try to minimize it nevertheless.
Knowing when and where a mutual fund is likely to buy or sell (to offload a position) can help you as a day trader, since the effect of their capital on the market may support your position, given that you’re trading in their direction.
What are the odds of choosing the same buy or sell spots as other mutual fund managers? Many fund managers use the VWAP, buying when an asset is momentarily undervalued or selling when it is momentarily overvalued. By doing it in this manner, institutional buyers can push up or push down prices to the “average” price and not beyond it.
Micro E-mini S&P (MES) – 1-hour chart – July 21 – 26, 2022
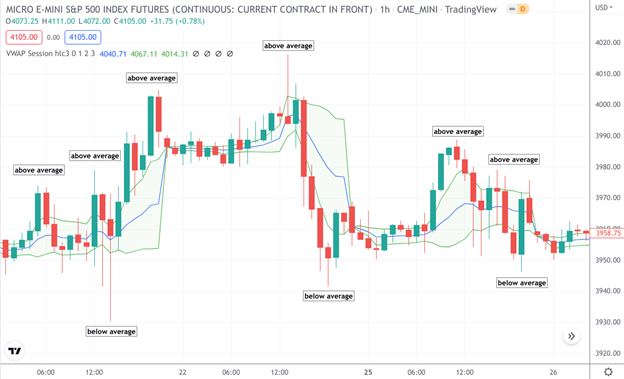
Source: TradingView
We can only speculate whether institutional funds bought or sold at any of the points labeled below average (price) and above average (price).
VWAP is not a surefire way to get on “the right side of the market” on any given day. But it does provide you the same price map that other institutional traders may be using. This alone should be helpful as another tool to help you time your buys and sells. Good luck!
Please be aware that the content of this blog is based upon the opinions and research of GFF Brokers and its staff and should not be treated as trade recommendations. There is a substantial risk of loss in trading futures, options and forex. Past performance is not necessarily indicative of future results.
Disclaimer Regarding Hypothetical Performance Results: HYPOTHETICAL PERFORMANCE RESULTS HAVE MANY INHERENT LIMITATIONS, SOME OF WHICH ARE DESCRIBED BELOW. NO REPRESENTATION IS BEING MADE THAT ANY ACCOUNT WILL OR IS LIKELY TO ACHIEVE PROFITS OR LOSSES SIMILAR TO THOSE SHOWN. IN FACT, THERE ARE FREQUENTLY SHARP DIFFERENCES BETWEEN HYPOTHETICAL PERFORMANCE RESULTS AND THE ACTUAL RESULTS SUBSEQUENTLY ACHIEVED BY ANY PARTICULAR TRADING PROGRAM.
ONE OF THE LIMITATIONS OF HYPOTHETICAL PERFORMANCE RESULTS IS THAT THEY ARE GENERALLY PREPARED WITH THE BENEFIT OF HINDSIGHT. IN ADDITION, HYPOTHETICAL TRADING DOES NOT INVOLVE FINANCIAL RISK, AND NO HYPOTHETICAL TRADING RECORD CAN COMPLETELY ACCOUNT FOR THE IMPACT OF FINANCIAL RISK IN ACTUAL TRADING. FOR EXAMPLE, THE ABILITY TO WITHSTAND LOSSES OR TO ADHERE TO A PARTICULAR TRADING PROGRAM IN SPITE OF TRADING LOSSES ARE MATERIAL POINTS WHICH CAN ALSO ADVERSELY AFFECT ACTUAL TRADING RESULTS. THERE ARE NUMEROUS OTHER FACTORS RELATED TO THE MARKETS IN GENERAL OR TO THE IMPLEMENTATION OF ANY SPECIFIC TRADING PROGRAM WHICH CANNOT BE FULLY ACCOUNTED FOR IN THE PREPARATION OF HYPOTHETICAL PERFORMANCE RESULTS AND ALL OF WHICH CAN ADVERSELY AFFECT ACTUAL TRADING RESULTS.