OVERVIEW:
- The Three Rising Valleys pattern is a bullish chart formation, suggesting a potential price increase for an asset such as a stock, commodity, or currency.
- Trading the pattern involves either standard or early entry methods, with a stop loss placed under the third valley to manage risk.
- While the pattern has favorable statistics, combining technical analysis with other analytical methods and risk management strategies is essential for informed decision-making.
Surely, you’ve seen instances wherein an asset is exhibiting three consecutive higher lows that outline an ascending trend. If so, what you’re looking at is called a Three Rising Valleys pattern.
The Three Rising Valleys chart pattern is a common pattern that can be seen in the markets. This pattern is identified by looking for any three valleys that are rising and appear similar to each other. The only rule is that each “valley” should be higher than the previous one. Here’s what it looks like.
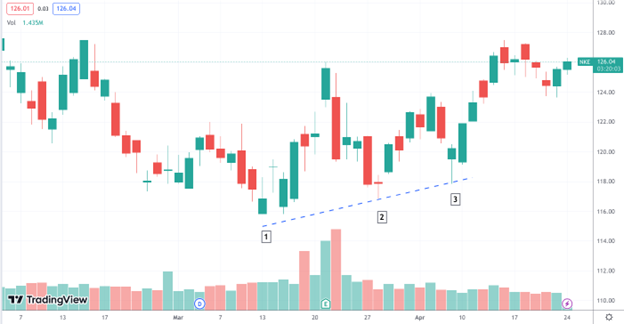
Note the rising valleys and the trendline illustrating the ascent. Also, note that the second peak is lower than the first. This is why the most important rule concerns the valleys and not the peaks.
What Does the Three Rising Valleys Indicate?
The Three Rising Valleys chart pattern is a bullish formation in technical analysis, which suggests that the price of an asset (such as a stock, commodity, or currency) is likely to rise.
This pattern occurs when the price of the asset forms three consecutive higher lows (valleys) within a defined uptrend.
Here’s how the pattern typically unfolds:
- First valley: The asset price declines, forming a low point, and then starts to rebound.
- Second valley: The price falls again but reaches a higher low than the first valley before rebounding.
- Third valley: The price declines for the third time, creating another higher low than the second valley, followed by a rebound.
The pattern is considered complete when the price breaks above the highest peak (resistance level) formed between the second and third valleys. The breakout above this resistance level serves as a buy signal, suggesting that the upward trend is likely to continue.
What Are Its Stats?
According to Thomas Bulkowski’s Encyclopedia of Chart Patterns, the Three Rising Valleys pattern has a low failure rate: 10%.
On average, the price increased by 48%. In 66% of cases, the price went back to its previous level temporarily before continuing the trend. And in 57% of cases, the price reached the expected target.
As favorable as these stats may seem, it’s essential to keep in mind that no chart pattern can guarantee future price movements. Technical analysis should be used in conjunction with other types of analysis and risk management strategies to make informed trading decisions.
How Do You Trade the Three Rising Valleys?
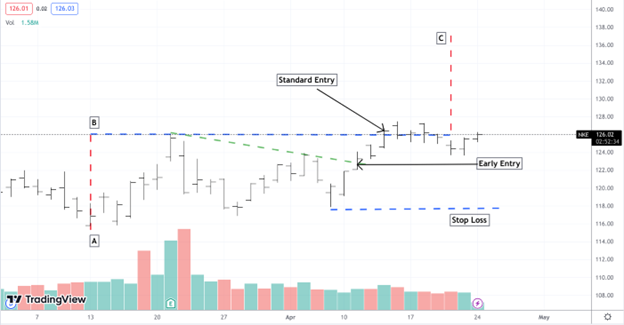
First, subtract the top of the formation [B] from the bottom of the formation [A] and add the balance to the top of the formation in order to get a target [C].
In the hypothetical example above, we subtract the top (126) from the bottom (115) and arrive with a balance of 11. We add that to the top and it gives us a target of 137.
Note that traders will have different “take profit” targets ranging anywhere from 60% to 100% of the complete measured move (the 100% move based on the height of the formation). Choose your target accordingly.
There are two ways to enter a trade (“long” position): the Standard entry and the early entry.
Standard entry: you go long upon a breakout of the top of the formation (resistance).
Early entry: If there’s a shorter-term trendline that can be drawn from the top of the formation, you enter the market upon a breakout of that trend line (see green short-term trend line).
Stop Loss: Place it under the 3rd valley (see chart).
Overall, this is a pattern that takes place frequently enough to trade often and whose stats are favorable enough to trade relatively safely.
The Bottom Line
The Three Rising Valleys pattern is a bullish technical analysis formation that hints at an upward trend in an asset’s price. It’s all about those three higher lows in a row, showing us the potential for growth. But remember, nothing’s ever set in stone, and it’s always a good idea to emphasize strict risk management rules for when the pattern doesn’t go your way.
When it comes to trading this pattern, you’ve got two choices to enter the market. You can choose between standard entry, which means jumping in after a breakout at the top of the formation, or early entry by catching a breakout of a shorter-term trendline. And don’t forget to set your stop loss below the third valley to keep things in check. Profit targets can vary, so pick yours based on what works best for you.
As you keep an eye on the markets, the Three Rising Valleys pattern could be a useful tool to help you spot some great opportunities. But, as always, remember to use it alongside other analysis techniques to make the best possible trading decisions. Happy trading!
Please be aware that the content of this blog is based upon the opinions and research of GFF Brokers and its staff and should not be treated as trade recommendations. There is a substantial risk of loss in trading futures, options and forex. Past performance is not necessarily indicative of future results.
Be advised that there are instances in which stop losses may not trigger. In cases where the market is illiquid–either no buyers or no sellers–or in cases of electronic disruptions, stop losses can fail. And although stop losses can be considered a risk management (loss management) strategy, their function can never be completely guaranteed.
Disclaimer Regarding Hypothetical Performance Results: HYPOTHETICAL PERFORMANCE RESULTS HAVE MANY INHERENT LIMITATIONS, SOME OF WHICH ARE DESCRIBED BELOW. NO REPRESENTATION IS BEING MADE THAT ANY ACCOUNT WILL OR IS LIKELY TO ACHIEVE PROFITS OR LOSSES SIMILAR TO THOSE SHOWN. IN FACT, THERE ARE FREQUENTLY SHARP DIFFERENCES BETWEEN HYPOTHETICAL PERFORMANCE RESULTS AND THE ACTUAL RESULTS SUBSEQUENTLY ACHIEVED BY ANY PARTICULAR TRADING PROGRAM.
ONE OF THE LIMITATIONS OF HYPOTHETICAL PERFORMANCE RESULTS IS THAT THEY ARE GENERALLY PREPARED WITH THE BENEFIT OF HINDSIGHT. IN ADDITION, HYPOTHETICAL TRADING DOES NOT INVOLVE FINANCIAL RISK, AND NO HYPOTHETICAL TRADING RECORD CAN COMPLETELY ACCOUNT FOR THE IMPACT OF FINANCIAL RISK IN ACTUAL TRADING. FOR EXAMPLE, THE ABILITY TO WITHSTAND LOSSES OR TO ADHERE TO A PARTICULAR TRADING PROGRAM IN SPITE OF TRADING LOSSES ARE MATERIAL POINTS WHICH CAN ALSO ADVERSELY AFFECT ACTUAL TRADING RESULTS. THERE ARE NUMEROUS OTHER FACTORS RELATED TO THE MARKETS IN GENERAL OR TO THE IMPLEMENTATION OF ANY SPECIFIC TRADING PROGRAM WHICH CANNOT BE FULLY ACCOUNTED FOR IN THE PREPARATION OF HYPOTHETICAL PERFORMANCE RESULTS AND ALL OF WHICH CAN ADVERSELY AFFECT ACTUAL TRADING RESULTS.