OVERVIEW:
- The Detrended Price Oscillator (DPO) helps identify market cycles by focusing on cyclical patterns that dictate price peaks and troughs, excluding ongoing trends.
- DPO can be a useful tool in determining entry and exit points, identifying overbought/oversold conditions, and complementing other technical indicators.
- It’s important to remember that the DPO doesn’t provide trading signals on its own and should be used alongside other analysis tools to better understand market trends and potentially anticipate future reversal points.
The ability to pinpoint a market cycle is key for staying in tune with the ebbs and flows of both trending and non-trending assets. In other words, it helps to know when price might be reaching a peak or hitting a trough before continuing in its direction, whether upward, downward, or sideways. Accurately measuring a cycle can give you an edge in timing market turns, allowing you to potentially capitalize on opportunities that are still in the process of forming.
One such tool that has gained traction among traders and analysts for its effectiveness in measuring cycles is the detrended price oscillator (DPO). The DPO offers a unique perspective on the underlying market dynamics of an asset. By removing the influence of prevailing trends, it enables you to focus solely on the cyclical patterns that dictate price peaks and troughs.
Detrended Price Oscillator – What Is It and How Does It Work?
The Detrended Price Oscillator is a tool used in financial analysis to figure out how long it takes for price cycles to go from one peak to another, or from one low point to another. In simpler terms, it helps to identify the time gap between two high points or two low points in the market.
To do this, it looks at an average of past prices and compares it to an earlier price from around the middle of the time frame we’re studying. If you’re curious as to how it’s calculated, here’s the formula:
DPO = Close (n/2 + 1 Periods ago) – n Period SMA
By checking the highs and lows on the indicator that match the highs and lows in actual prices, you can work out the time between these points. You can then use this information to estimate when a new high or low might happen.
Like every indicator the Detrended Price Oscillator has its advantages and limitations which you should be aware of if you plan to use it in your trading.
Advantages and Limitations of the DPO
Let’s start with the ADVANTAGES.
- It identifies cycles: DPO helps in identifying and analyzing market cycles by removing the long-term trend.
- It identifies overbought/oversold levels: DPO can signal potential overbought or oversold market conditions, providing trading opportunities.
- Good for timing: DPO can help determine entry and exit points by identifying short-term price fluctuations.
- It’s incredibly versatile: DPO is applicable to various timeframes and asset classes, including stocks, forex, and commodities.
- It can complement other tools: DPO can be used alongside other technical indicators for a more comprehensive analysis.
Now, the LIMITATIONS.
- It’s a lagging indicator: DPO is a lagging indicator and can provide signals after a trend has already begun or reversed.
- It can sometimes give false signals: DPO can generate false signals, leading to potential losses if not confirmed with other analysis tools.
- It’s not designed to indicate trend direction: DPO doesn’t provide information about the direction of the underlying trend, making it less useful for trend-following strategies.
- It requires fine-tuning: Optimal settings for DPO may differ across assets and timeframes, necessitating adjustments.
- It has no use beyond cycles: DPO is primarily designed for cycle analysis, making it less useful for traders focused on other aspects of technical analysis.
DPO in Action
Let’s look at a simple example to help you understand better:
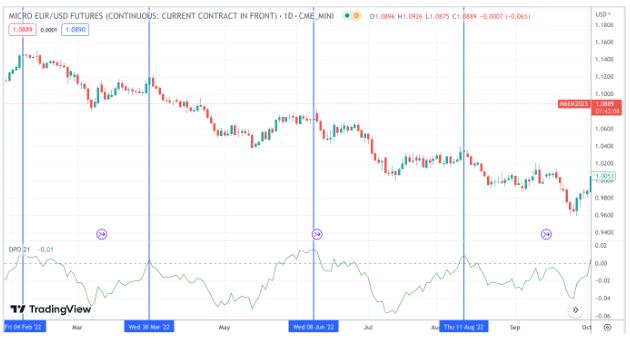
On a daily chart of the Micro Euro Futures (M6E) from February through October 2022, we found instances in which the oscillator and prices both reached their highest points: February 4, March 30, June 8, and August 11. All of the peaks would have served as effective “short” market entries.
Here’s another example of the MES (Micro-emini S&P futures).
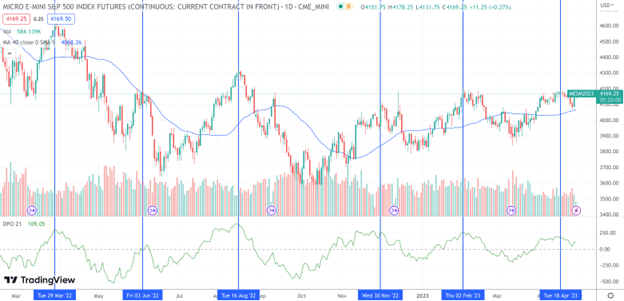
Notice the 3-month and 2-month cycles between peaks – What might that say about the market today with regard to its position in the cycle?
When using the DPO, remember that it doesn’t give trading signals by itself. Instead, it offers a reference point for anticipating future reversal points. Ultimately, it’s your job to figure out the trend, not the indicator’s. So, if the asset keeps going up or down non-stop, it’s better not to enter the market unless the DPO peak or trough corresponds with a market pullback (up or down). Lastly, as shown in the example, the highs and lows in the indicator aren’t always at the same level. Focus on the price peaks and valleys, and then check if they match with the indicator. Remember, price comes first, the DPO second.
The Bottom Line
Identifying market cycles is important for understanding the ups and downs of various assets. Knowing when a price might reach its highest or lowest point before continuing in its direction can give you an advantage in timing market changes and capitalizing on opportunities.
The Detrended Price Oscillator (DPO) is a popular tool among traders and analysts for measuring cycles. By removing the influence of ongoing trends, it helps you focus on the patterns that cause price highs and lows. Although it has its limitations, the DPO can be a useful addition to your trading toolbox, especially when used in combination with other technical indicators.
Remember that the DPO doesn’t provide trading signals on its own, and it’s up to you to determine the trend. Always focus on price movements first, and then use the DPO as a reference point to anticipate future reversal points. By keeping these points in mind and using the DPO effectively, you can improve your trading strategy and make more informed decisions in the market.
Please be aware that the content of this blog is based upon the opinions and research of GFF Brokers and its staff and should not be treated as trade recommendations. There is a substantial risk of loss in trading futures, options and forex. Past performance is not necessarily indicative of future results.
Disclaimer Regarding Hypothetical Performance Results: HYPOTHETICAL PERFORMANCE RESULTS HAVE MANY INHERENT LIMITATIONS, SOME OF WHICH ARE DESCRIBED BELOW. NO REPRESENTATION IS BEING MADE THAT ANY ACCOUNT WILL OR IS LIKELY TO ACHIEVE PROFITS OR LOSSES SIMILAR TO THOSE SHOWN. IN FACT, THERE ARE FREQUENTLY SHARP DIFFERENCES BETWEEN HYPOTHETICAL PERFORMANCE RESULTS AND THE ACTUAL RESULTS SUBSEQUENTLY ACHIEVED BY ANY PARTICULAR TRADING PROGRAM.
ONE OF THE LIMITATIONS OF HYPOTHETICAL PERFORMANCE RESULTS IS THAT THEY ARE GENERALLY PREPARED WITH THE BENEFIT OF HINDSIGHT. IN ADDITION, HYPOTHETICAL TRADING DOES NOT INVOLVE FINANCIAL RISK, AND NO HYPOTHETICAL TRADING RECORD CAN COMPLETELY ACCOUNT FOR THE IMPACT OF FINANCIAL RISK IN ACTUAL TRADING. FOR EXAMPLE, THE ABILITY TO WITHSTAND LOSSES OR TO ADHERE TO A PARTICULAR TRADING PROGRAM IN SPITE OF TRADING LOSSES ARE MATERIAL POINTS WHICH CAN ALSO ADVERSELY AFFECT ACTUAL TRADING RESULTS. THERE ARE NUMEROUS OTHER FACTORS RELATED TO THE MARKETS IN GENERAL OR TO THE IMPLEMENTATION OF ANY SPECIFIC TRADING PROGRAM WHICH CANNOT BE FULLY ACCOUNTED FOR IN THE PREPARATION OF HYPOTHETICAL PERFORMANCE RESULTS AND ALL OF WHICH CAN ADVERSELY AFFECT ACTUAL TRADING RESULTS.