Predicting market bottoms (and tops) can be extremely difficult and at times nearly impossible. But waiting for a bottoming formation might make it easier for traders to identify a tradeable setup. It’s important not to confuse the two–predicting a bottom is claiming a price point (or range) for reversal, while identifying a bottoming formation is to wait for some evidence that a potential bottom may be forming.
From December 2018 to July 2019, we saw two bottoming formations in crude oil futures.
The first bottoming pattern–a Pipe Bottom–took place on December 24, 2019.
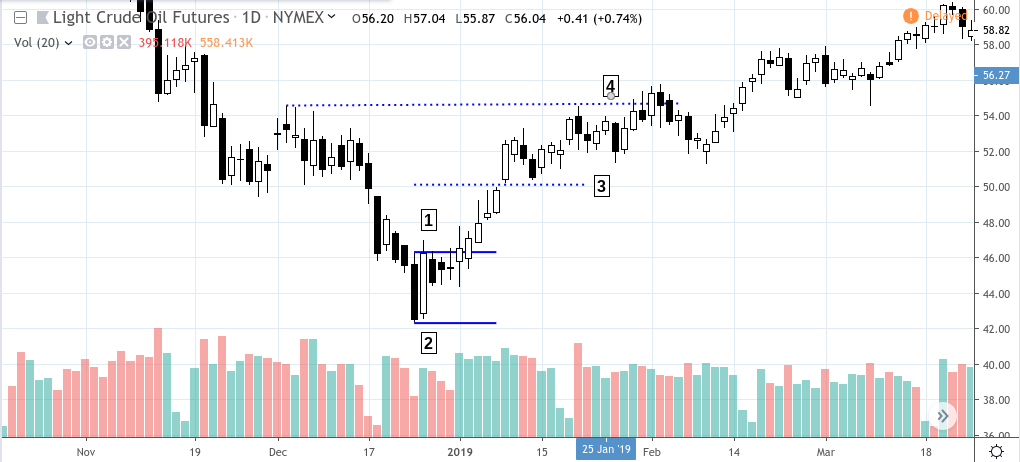
Crude Oil (CL) Daily – November 5, 2018 to March 26, 2019
The December 26 bounce-back might have been an indication that a pipe bottom had just occurred. There’s no way of being certain about this at the moment that it took place. However, the formation was there and it did present a trade setup (pipe bottom setup).
When CL bounced back on December 26, a trader might have immediately went long the market at [1] as price closed above the top of the previous candle that formed the “spike” of the pipe bottom.
One traditional approach would be to measure the height of the spike–subtracting the top (46.24) from the bottom (42.36)–and to add the difference to the top. In this case, the trader would enter at [1], place a stop loss a few ticks below [2].
The difference of 3.88 would be added to 46.24 to get a price target of 50.12 which is shown at [3]. Bear in mind that this target is a contrived figure based on a traditional calculation and not at all based on the surrounding market context. If a trader wanted to use a more market-based figure, as in the case of a resistance level, then resistance level at [4] at the price of 54.55 may have been more suitable.
Another alternative would have been to use both price targets, unloading have a position at the near-term target of [3] and the second half at the far-end target at [4]. Either way, price advanced to meet both targets.
The second formation–Double Bottom–took place between June 5 – 12, 2019.
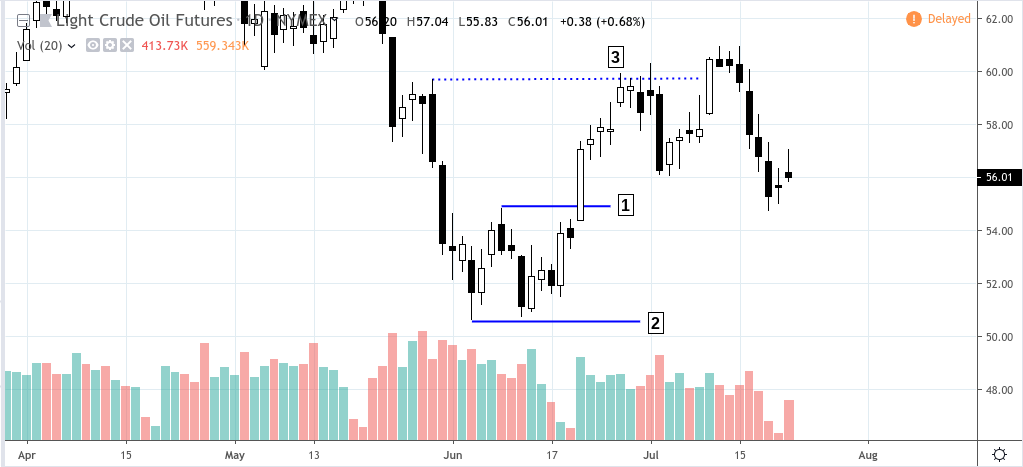
Crude Oil (CL) Daily – March 28 to July 22,, 2019
For this scenario, let’s take an easier approach. The highest peak of the double bottom is at [1], the price of 54.84. A swing trader might have placed a buy stop at that level. A good stop loss point would have been a few points below [2], the lowest valley near 50.60. A seemingly reasonable price target would be at [3] which is the most recent swing high (May 30) at the price of 59.70, which eventually got hit prior to price declining once again from that resistance level.
Bottoming patterns present us with observable and possibly actionable trading formations. Their clarity is what makes them reasonably advantageous (you know where to enter, where to exit at a loss, and where to exit in terms of a potential profit). As with every pattern, bottoming formations do have a failure rate, so you should always anticipate a pattern breakdown as part of your trading plan.
Please be aware that the content of this blog is based upon the opinions and research of GFF Brokers and its staff and should not be treated as trade recommendations. There is a substantial risk of loss in trading futures, options and forex. Past performance is not necessarily indicative of future results.
Be advised that there are instances in which stop losses may not trigger. In cases where the market is illiquid–either no buyers or no sellers–or in cases of electronic disruptions, stop losses can fail. And although stop losses can be considered a risk management (loss management) strategy, their function can never be completely guaranteed.
Disclaimer Regarding Hypothetical Performance Results: HYPOTHETICAL PERFORMANCE RESULTS HAVE MANY INHERENT LIMITATIONS, SOME OF WHICH ARE DESCRIBED BELOW. NO REPRESENTATION IS BEING MADE THAT ANY ACCOUNT WILL OR IS LIKELY TO ACHIEVE PROFITS OR LOSSES SIMILAR TO THOSE SHOWN. IN FACT, THERE ARE FREQUENTLY SHARP DIFFERENCES BETWEEN HYPOTHETICAL PERFORMANCE RESULTS AND THE ACTUAL RESULTS SUBSEQUENTLY ACHIEVED BY ANY PARTICULAR TRADING PROGRAM.
ONE OF THE LIMITATIONS OF HYPOTHETICAL PERFORMANCE RESULTS IS THAT THEY ARE GENERALLY PREPARED WITH THE BENEFIT OF HINDSIGHT. IN ADDITION, HYPOTHETICAL TRADING DOES NOT INVOLVE FINANCIAL RISK, AND NO HYPOTHETICAL TRADING RECORD CAN COMPLETELY ACCOUNT FOR THE IMPACT OF FINANCIAL RISK IN ACTUAL TRADING. FOR EXAMPLE, THE ABILITY TO WITHSTAND LOSSES OR TO ADHERE TO A PARTICULAR TRADING PROGRAM IN SPITE OF TRADING LOSSES ARE MATERIAL POINTS WHICH CAN ALSO ADVERSELY AFFECT ACTUAL TRADING RESULTS. THERE ARE NUMEROUS OTHER FACTORS RELATED TO THE MARKETS IN GENERAL OR TO THE IMPLEMENTATION OF ANY SPECIFIC TRADING PROGRAM WHICH CANNOT BE FULLY ACCOUNTED FOR IN THE PREPARATION OF HYPOTHETICAL PERFORMANCE RESULTS AND ALL OF WHICH CAN ADVERSELY AFFECT ACTUAL TRADING RESULTS.