Nearly three decades ago, right before the advent of 24-hour online markets, digital finance, dancing baby videos, and fake news memes, commodity markets actually closed for the day.
This meant that if you wanted to trade, you had to wait until the next day for the market to open. And if some big economic event or news took place overnight, you and every other trader in the world had to wait until the opening bell to see the market’s (delayed) response.
As we know, rarely do markets close at the same price they had opened. Markets typically end higher or lower. And during a market’s trading hours, there’s typically a moment when either the bulls drive the price higher for the day or the bears claw price back down to end in a decline.
Since the opening market hours typically have, on average, the highest volume of trading, many speculators believed that it was during this narrow window of time that the day’s trend, be it bullish or bearish, was to be decided.
Hence, many day traders attempted to trade a breakout of this opening conflict, going long if the prices broke out toward the upside, and short if the market broke toward the downside. This general strategy was called the Opening Range Breakout, or ORB.
In Today’s Digital Market, the Trading Environment Is Different
Nowadays, trading pits–largely a thing of the past–no longer dictate market hours. Most commodity markets trade on a nearly 24-hour basis. Global markets are accessible from almost anywhere in the world via internet. And market response to economic or geopolitical events can take place instantaneously on any business day.
Given these changes, does the market’s “opening range” still hold the same relevance it once held before the digital age? After all, traders don’t have to wait until the traditional market open to trade most markets. They can trade almost any second of the day, on a 24/5 basis, from any timezone.
In a sense, there really is no “opening” if that signifies a starting point from which every trader and financial institution across the globe must synchronously begin.
Not Everything Has Changed, Especially With Regard to Index Futures
In the case of index futures such as those for the S&P 500, Dow Jones Industrial Average, Nasdaq 100, and the Russell 2000, futures contracts are correlated to the stock market. The US stock market still retains its traditional trading schedule–it’s morning open and afternoon close.
Although stock index futures may trade throughout the day, on a 24-hour basis, most of the trading volume (for both the stocks and their futures derivatives) occurs during the stock market trading hours. So, no matter where the price of, say, the S&P 500 futures may head during the “overnight” session, once the US stock market opens, any mismatch in price between the stock index and the futures index is typically “resolved” during traditional stock market hours.
This means that the opening range for index futures may still provide an important window of opportunity for any day trader attempting to ride the day’s trend. But although the opening range may still be a relevant inflection point, there are still a few differences to note.
What “Opening Range” Might Mean Today
Today, when markets can be traded on a near 24-hour basis, “opening range” is less defined by a time range–the market open–than it is by the events that surround that range.
Suppose you trade the Emini S&P or Dow, what difference does it make that the NYSE opens at 9:30 am ET if a highly-anticipated Federal Reserve speech takes place at 8:00 am ET or later at 10:30 am ET?
In the case of the former, U.S. indices might have already moved well before the market open. In the case of the latter, index movements prior to the 10:30 am speech may have less significance until after the speech, when institutional traders and investors have had a few minutes to contemplate the implications of the speech.
Yet, the time between 9:30 am to 11:00 am ET, at least for the S&P, Dow, Nasdaq, and Russell 2000, still holds on average the highest volume of trading activity for the day’s session, making the opening period a relatively important moment during the trading day.
So, if you were to attempt to trade a breakout of the opening range, with the aim of riding the day’s short-term trend, how might you do it?
A New Approach to Trading the Opening Range
Here’s one way of going about it:
- First, don’t focus on the “opening,” as much as the events within or surrounding the opening. It may help you to be aware of the fundamental events happening around the market open (e.g. Jobless Claims report at 8:30 am ET, or Construction Spending reports at 10:00 am ET).
- Second, take a wider perspective: don’t trade the highs or lows of the opening itself, but the relative swing highs and lows of the general shape of the markets surrounding the opening.
- Third, be prepared to carefully manage your positions as not all ORB trades work out.
- Fourth, since you may be day trading the opening range breakout (and not holding it beyond the market close, as in swing or position trading), you might want to target the nearest possible swing high or low as your profit target.
- In terms of the last point, not only does this give you an objective exit level, it allows you to measure risk-to-return (stop loss to profit target) which in turn might help you determine the appropriate position size for your trade.
Let’s take a look at a few hypothetical examples:
Example 1
E-Mini Dow (YM Continuous Contract) 15-Minute March 7 to March 11, 2019
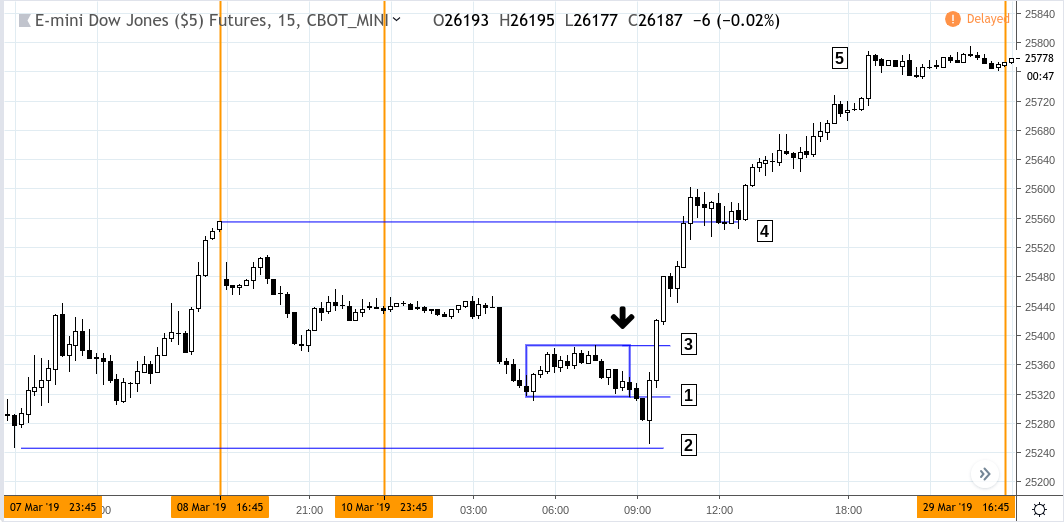
- Retail Sales released at 8:30 am ET
- Business Inventories released at 10:00 am ET
This would have been a relatively tricky session to trade as two breakouts occurred, the first of which might have been a loss, a breakeven trade, or a profitable trade depending on how you managed the trade before its reversal; and the second breakout potentially yielding a profit that exceeded our initial target.
First Trade:
The first trade at [1] presented a scenario where you would have risked 76 points to gain 33 points with the downside target at March 8 support [2] , a risk-to-return of 2.3-to-1. Not good odds. When the risk is greater than the potential return, you may want to avoid the trade (is it really worth it?).
If you happened to take the trade, your profit target at [2] was never reached: you might have moved your stop to your entry point to attempt a breakeven trade (you have roughly 20 minutes to manage this), you might have taken profits as you came within 5 points of your target (you could have easily missed this), or you might have taken the 76 point loss.
Second Trade:
If you waited for a potential upside breakout, you would have had a return-to-risk scenario of 2.22-to-1, as you would have risked 76 points for a potential return of 169 points. The breakout at [3] took place at 9:45 am, and reached its target at [4], the March 8 swing high around 10:45 am ET. If you held on longer, you might have seen the YM exceed our initial target, breaking above the March 7 high of 25,741 as shown at [5].
Example 2
E-Mini Dow (YM Continuous Contract) 15-Minute April 21 to April 22, 2019
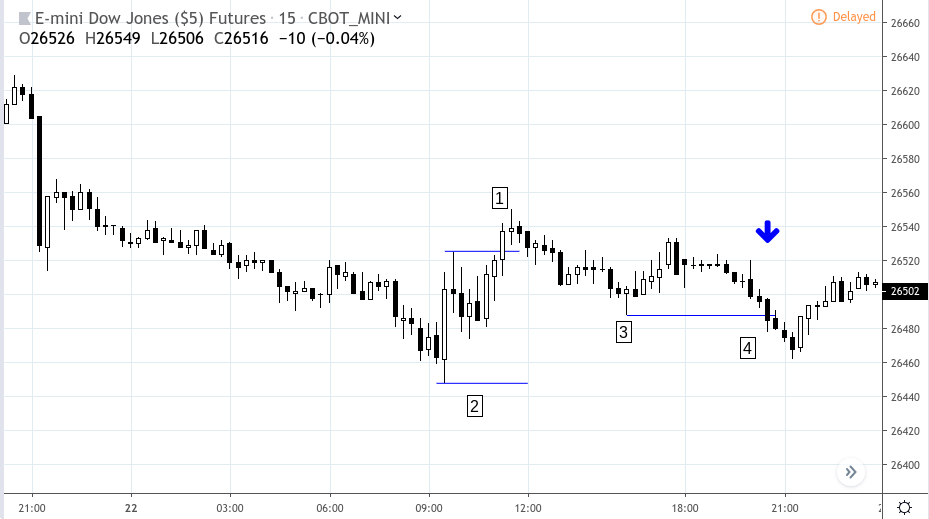
On the morning of April 22, the YM established a relative swing low at 9:30 am ET and a relative swing high at 9:45 am ET. The pullback following the 9:45 am bar appeared to have a potential set up in place from which the YM may break higher or lower.
Here’s the fundamental context:
- At 10:30 am ET, Existing Home Sales report was scheduled to be released.
- Among the 77 S&P 500 companies reporting so far, nearly 78% have beaten earnings expectations, giving the market a potentially bullish outlook.
Given the reasonably positive sentiment (due to the S&P earnings) a buy stop might have been placed at [1] anticipating a breakout, with a stop loss set at [2] below the 9:30 am bar.
Home sales came in at 5.2 million, but the figure was slightly under the 5.3 million consensus expectation. Although this perceptively lackluster figure may have been enough to lift the market, as the price broke through the swing high at [1], it wasn’t enough to support it throughout the day.
Although price did not violate the swing low at [2]–an indication of a potential downtrend–price failed to follow through beyond the breakout. Perhaps by 3:00 pm ET, one would have sensed a flat market, raising a stop loss to [3], a point at which a new swing low had been established. In that case, that level would have been taken out at [4] during the Asa-Pacific session at around 9:00 pm. The trade would have resulted in a loss of approximately 40 points.
Example 3
E-Mini Dow (YM Continuous Contract) 15-Minute April 25, 2019
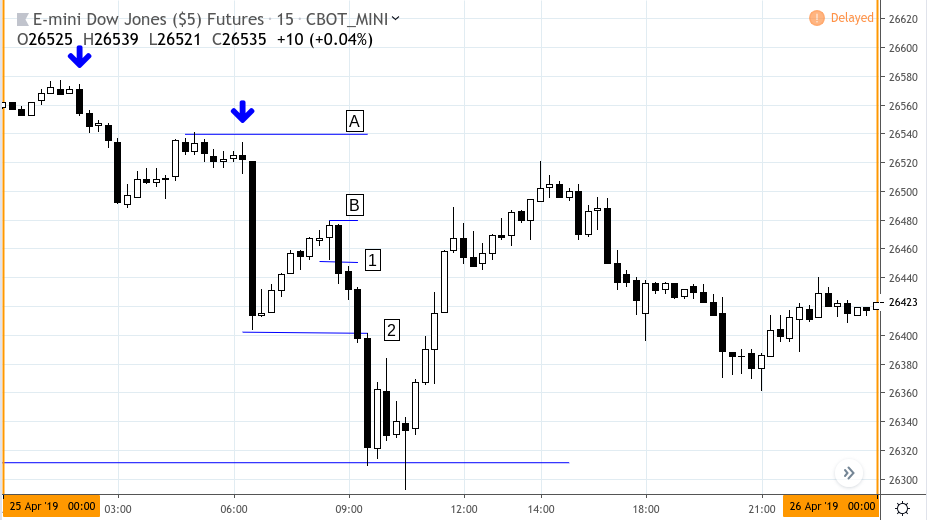
The morning of April 25 presented us with a mixed technical and fundamental context. On one hand, the short-term technical trend presented us with a downtrend (see arrows). On the other hand, the economic reports released that day presented both positive and negative figures.
- Durable Goods Orders – 8:30 am ET
- Jobless Claims – 8:30 am ET
Durable goods surged to a 7-month high at 2.7%. Economists were expecting a mere 0.8% increase. Jobless claims, however, increased by 37,000 to 230,000 in the week ending April 20. Economists were expecting a figure of 200,000.
If your bias was toward the upside following those reports, you might have placed a buy stop at the swing high at [A]. This would not have resulted in a trade as price wouldn’t have reached that level in the minutes following 8:30 am ET.
If your bias was toward the downside, you would have had two trades. The first trade at [1] is an early entry trade where the uptrend represented a small upward “correction.” Going short the downside breakout at of the swing high you might have placed a stop loss at the top of the high bar [B]. Your second trade would have been at the break below the most recent swing low at [2], with a stop at [B].
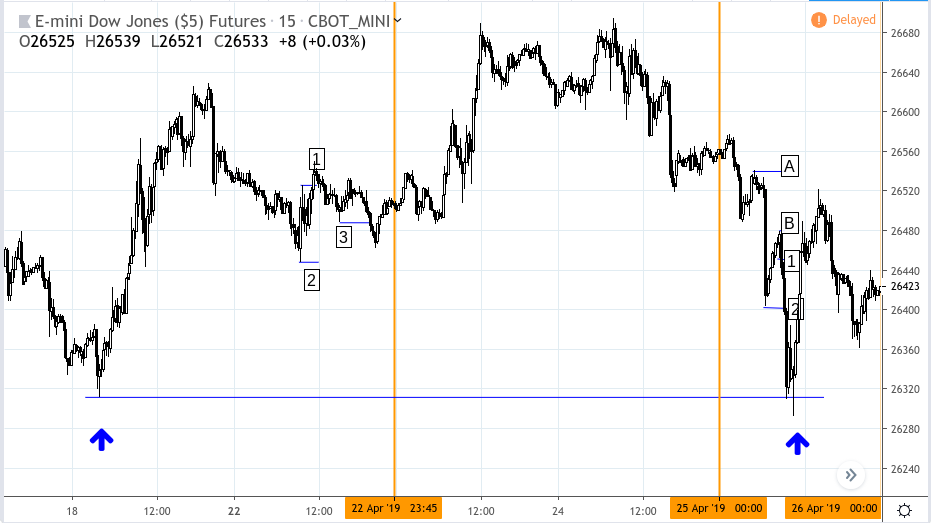
Either breakdown might have worked as price rapidly declined following the Durable Goods and Jobless Claims. Given the swing trading context, the question now is where you might have placed your profit target. We identified the price zone of 26300 to 26310. Anticipating a bounce from previous support, this price zone appeared as a probable stopping point as it served as a strong support level on April 18, 2019 (see blue arrows).
E-Mini Dow (YM Continuous Contract) 15-Minute April 17 to April 25, 2019
Opening range breakouts may still be a valid concept to trade, but you may need to slightly alter or expand your notion of what “opening range” means in today’s market environment. Because large market moves can happen almost anytime within the 24-hour period, the opening range may reflect more immediate reactions to events and reports surrounding the market open rather than reactions to events/reports that took place overnight.
Nevertheless, when trading the opening range, it might help to get a broader overview of the technical and fundamental context surrounding the market open rather than trading with just the immediate range in view.
Please be aware that the content of this blog is based upon the opinions and research of GFF Brokers and its staff and should not be treated as trade recommendations. There is a substantial risk of loss in trading futures, options and forex. Past performance is not necessarily indicative of future results.
Be advised that there are instances in which stop losses may not trigger. In cases where the market is illiquid–either no buyers or no sellers–or in cases of electronic disruptions, stop losses can fail. And although stop losses can be considered a risk management (loss management) strategy, their function can never be completely guaranteed.
Disclaimer Regarding Hypothetical Performance Results: HYPOTHETICAL PERFORMANCE RESULTS HAVE MANY INHERENT LIMITATIONS, SOME OF WHICH ARE DESCRIBED BELOW. NO REPRESENTATION IS BEING MADE THAT ANY ACCOUNT WILL OR IS LIKELY TO ACHIEVE PROFITS OR LOSSES SIMILAR TO THOSE SHOWN. IN FACT, THERE ARE FREQUENTLY SHARP DIFFERENCES BETWEEN HYPOTHETICAL PERFORMANCE RESULTS AND THE ACTUAL RESULTS SUBSEQUENTLY ACHIEVED BY ANY PARTICULAR TRADING PROGRAM.
ONE OF THE LIMITATIONS OF HYPOTHETICAL PERFORMANCE RESULTS IS THAT THEY ARE GENERALLY PREPARED WITH THE BENEFIT OF HINDSIGHT. IN ADDITION, HYPOTHETICAL TRADING DOES NOT INVOLVE FINANCIAL RISK, AND NO HYPOTHETICAL TRADING RECORD CAN COMPLETELY ACCOUNT FOR THE IMPACT OF FINANCIAL RISK IN ACTUAL TRADING. FOR EXAMPLE, THE ABILITY TO WITHSTAND LOSSES OR TO ADHERE TO A PARTICULAR TRADING PROGRAM IN SPITE OF TRADING LOSSES ARE MATERIAL POINTS WHICH CAN ALSO ADVERSELY AFFECT ACTUAL TRADING RESULTS. THERE ARE NUMEROUS OTHER FACTORS RELATED TO THE MARKETS IN GENERAL OR TO THE IMPLEMENTATION OF ANY SPECIFIC TRADING PROGRAM WHICH CANNOT BE FULLY ACCOUNTED FOR IN THE PREPARATION OF HYPOTHETICAL PERFORMANCE RESULTS AND ALL OF WHICH CAN ADVERSELY AFFECT ACTUAL TRADING RESULTS.