In a previous post, we discussed a technique to use Bollinger Bands to fade what might be interpreted as “extreme” market moves, anticipating that price might revert back to the “average” as measured by a Bollinger Band’s moving average line.
This is essentially trading against the trend.
Next, we will discuss how to use the bands to trade with the trend.
Bollinger Bands as Support and Resistance?
As you know, Bollinger Bands were developed to measure and forecast relative volatility. The outer bands represent the 2nd standard deviation of prices. The statistical assumption here is that 90% to 95% of movement should occur within the bands.
This may lead traders to assume that Bollinger Bands are a good measure of support and resistance. Possibly, by why follow the bands when you can simply refer to objective market levels (swing high and swing low points where real buyers and sellers traded)?
We are not saying that the bands shouldn’t be used as support/resistance, as they do forecast levels of what might be considered the outer reaches according to statistical volatility measures. What we are suggesting, however, is that using market levels might be a better way to determine real trade entries and exits.
Using a Classic 1-2-3 Setup in Combination with Bollinger Bands
The following technique is a classic trading approach, one made prominent by trader and educator Joe Ross.
The main rule here is to avoid markets that have not touched the lower band or average line (for uptrends), or that have not touched the top band and average line (for downtrends).
In other words, avoid markets that are barely moving and have very little volatility, as such “constricted” markets may be subject to large jumps up or down as soon as buyers or sellers begin trading.
Let’s take a look at the Crude Oil Daily Chart from February 1 to May 24, 2018.
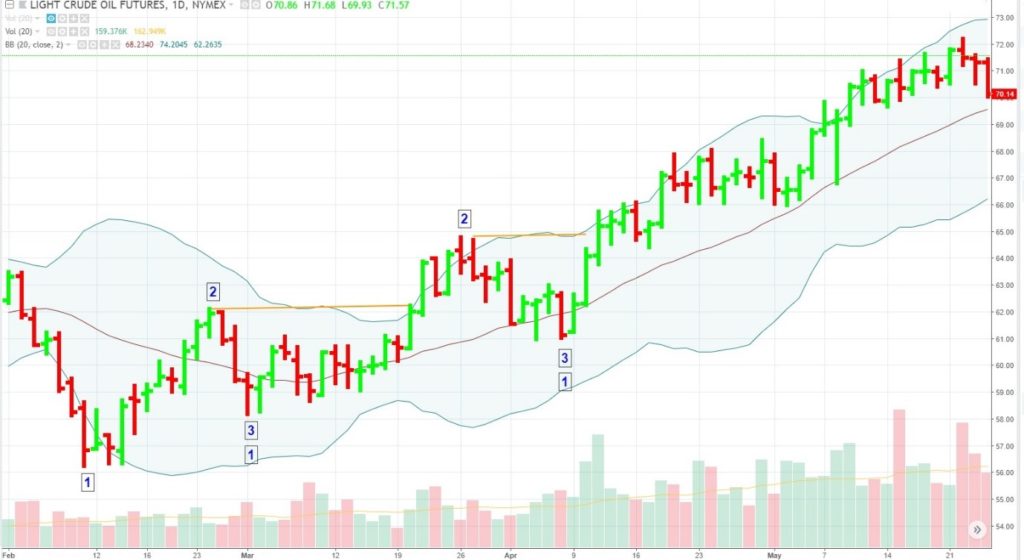
When prices trend, you can see a steady cycling of 1-2-3 sequences.
- Point (1) serves as the initial starting measure.
- Point (2) signals the swing high (or low, in a downtrend) from which price retraces back toward the starting measure.
- Point (3) serves as the higher (or lower, in a downtrend) swing low that stops short of the starting measure.
Point (3) is critical. For the trend to continue, the following movement from point (3) must exceed point (2), whether an uptrend or downtrend, but must not violate the starting measure at point (1).
If movement from point (3) continues in the forecasted direction—meaning that it exceeds point (2), then point (3) becomes a “new” point (1), and the cycle continues.
Important: any violation of point (1) or any failure to exceed point (2) signals uncertainty in the trend, a potential trend change toward consolidation or a flat market, or a potential trend reversal.
Let’s take another look at this principle. The following is a daily chart of Soybean Futures from December 29, 2017 to July 6, 2018.
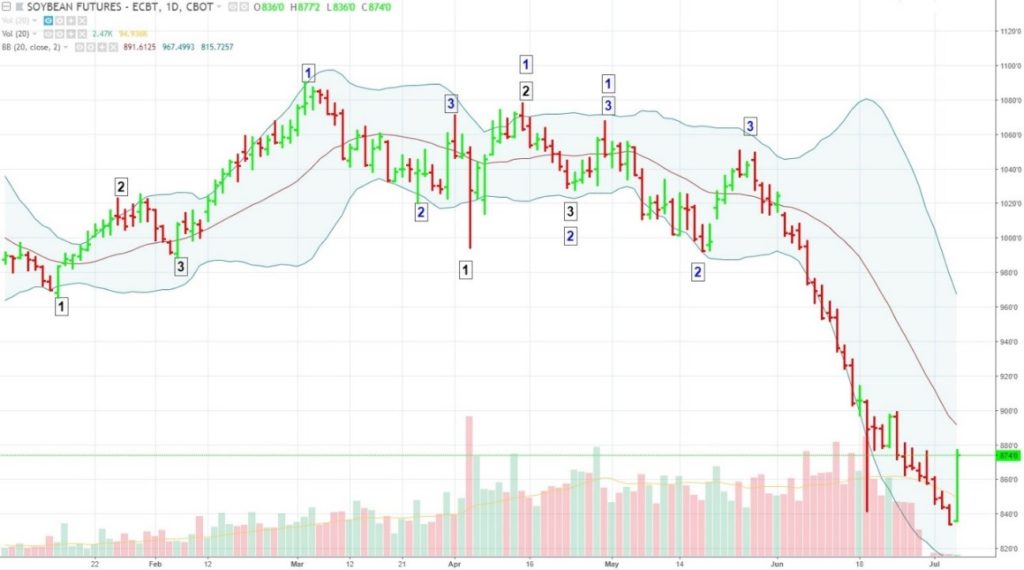
Long trade setups are color-coded Black. Short trade setups are color-coded Blue.
Trade Entries and Exits
Trade entries may vary depending on whether you prefer a more conservative or aggressive entry. A more conservative approach might be to wait until a breakout of (2), whereas a more aggressive entry might be at the top (if going long) of a down bar between (2) and an anticipated (3), or at the bottom of an up bas between (2) and an anticipated (3).
Trade exits depend on whether you are taking more of a swing trading strategy or a long-term position strategy, in which case you would be more reliant on fundamentals to determine the longer-term outlook.
As you can see, the first long trade yielded a favorable run to the upside. The second long trade would either have not had a fill if you were entering the market upon a breakout of (2), or a loss if you entered more aggressively.
In contrast, the first short trade would have been favorable if you had held on to the short position. The second short trade would have worked out as well. But the third short trade is what would have captured the long plunge downward.
More of an Art Than a Science
Like most technical approaches, the tactic we just outlined above is more of an art and not a science. It is not a sure-fire bet. However, it does give you an objective and potentially “actionable” way to project market movements. Just remember that projection is “preparation” but not “prediction.” So, trade cautiously.
Please be aware that the content of this blog is based upon the opinions and research of GFF Brokers and its staff and should not be treated as trade recommendations. There is a substantial risk of loss in trading futures, options and forex. Past performance is not necessarily indicative of future results.