Experienced traders understand that money management can be used to attempt to enhance profit potential while also strategizing to manage potential losses. Many traders assume that measuring your position size risks is just a “defensive” component of their money management plan, but it can also be used as an “aggressive” tool to attempt to squeeze more potential out of a trade. And the smaller the dollar-per-tick value in a given asset, the greater the capacity to implement such a strategy, especially if your trading account size is on the smaller side.
Take the Micro E-Mini Dow Jones futures, whose $0.50 per tick value is among the smallest offered within the world of exchange-traded derivatives.
Micro E-Mini Dow (MYM continuous contract) – Daily chart May 6 to July 10, 2019
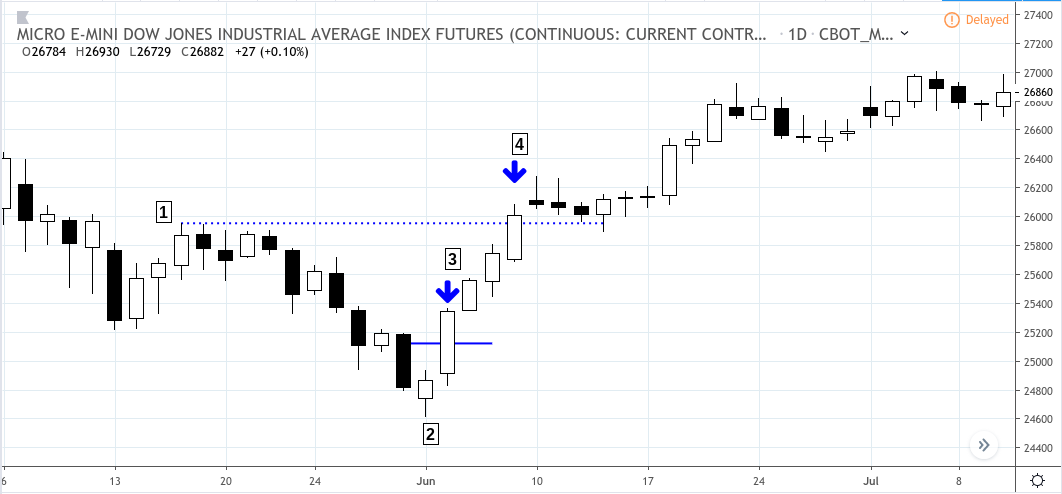
Let’s suppose you were fundamentally bullish given the market’s expectations of additional Fed rate cuts. You were looking to go long the Micro Dow given the right circumstances. On June 3, the MYM pulled back to a 38.2% Fib retracement from its December 26, 2018 valley of 21452 to its April 24, 2019 peak of 26694.
This pullback resembles a potential V-shaped recovery from a short-term low. The top of the V [1] begins at the price of 25954. It’s bottom [2] finds it low at the price of 24610. Let’s suppose you decided to enter a long position at 38.2% of the difference between the top and bottom (note that 38.2% is a traditional Fib measurement).
So, you find the difference between the top and the bottom (25954-24610) which is 1,344 points. You calculate that 38.2% of that move is roughly 513 points. So, your entry point [3] is at the price of 25123, and your positive exit point [4] is at the top of the V formation, again at 25954.
The Advantage of Using an Aggressive Money Management Strategy
A hypothetical situation: Let’s suppose your trading account equity was around $25,000. You decided that risking 3% per trade, which amounts to $750 per trade, suits your risk tolerance.
Trade scenario 1: If you had bought one contract of the MYM at the entry point [3], you probably didn’t have much to worry about as the MYM would have had to decline 1,500 points for you to lose $750. Your trade would have netted 831 points on the MYM, generating a gross return of $415. Let’s suppose you were paying round turn commissions and fees of $5.00, then your net return would have been $410.
Trade scenario 2: If you had used a more aggressive tactic, basing your $750 (3%) loss limit on a stop loss placed at the bottom of the pattern [2], then you would have been able to trade three contracts instead of just one. The difference between your entry point and the bottom of the V is 513 points. So if you divided $750 (your 3% relative loss limit) by 513, you would have come up with the dollar-per-tick value of $1.46 per tick which you decided to round up to $1.50 per tick (four cents higher than your risk limit). You need three MYM contracts to have your trade move at a 1.50-per-tick increment.
If you had placed a three-contract trade, upon closing your position at [4], you would have netted 831 points, generating a gross return of $1,246 and a net (minus $15 commissions & fees: $5/contract x 3) of $1,231.
Note the difference between $410 (trade 1) and $1,231 (trade 2), each risking around $750 per trade but using different money management methods–the more aggressive tactic generating a potential profit that exceeded the more defensive tactic by over 300%.
However, it is important to remember that these hypothetical trade scenarios are for a winning trade. Had this been a losing trade, the total loss for trade scenario 2 would have been magnified by three compared to that of trade scenario 1. The trader could choose to use a stop loss order in order to attempt to limit the loss, but be aware that stop loss orders may not necessarily limit losses to the intended amount.
How you place a trade (in terms of money management and position size) is often as important as the trade setup itself. So, next time you place a trade, it might help to see money management not only as a way of limiting market risk but as a way of exploiting potential advantage from a given trade scenario.
Please be aware that the content of this blog is based upon the opinions and research of GFF Brokers and its staff and should not be treated as trade recommendations. There is a substantial risk of loss in trading futures, options and forex. Past performance is not necessarily indicative of future results.
Be advised that there are instances in which stop losses may not trigger. In cases where the market is illiquid–either no buyers or no sellers–or in cases of electronic disruptions, stop losses can fail. And although stop losses can be considered a risk management (loss management) strategy, their function can never be completely guaranteed.
Disclaimer Regarding Hypothetical Performance Results: HYPOTHETICAL PERFORMANCE RESULTS HAVE MANY INHERENT LIMITATIONS, SOME OF WHICH ARE DESCRIBED BELOW. NO REPRESENTATION IS BEING MADE THAT ANY ACCOUNT WILL OR IS LIKELY TO ACHIEVE PROFITS OR LOSSES SIMILAR TO THOSE SHOWN. IN FACT, THERE ARE FREQUENTLY SHARP DIFFERENCES BETWEEN HYPOTHETICAL PERFORMANCE RESULTS AND THE ACTUAL RESULTS SUBSEQUENTLY ACHIEVED BY ANY PARTICULAR TRADING PROGRAM.
ONE OF THE LIMITATIONS OF HYPOTHETICAL PERFORMANCE RESULTS IS THAT THEY ARE GENERALLY PREPARED WITH THE BENEFIT OF HINDSIGHT. IN ADDITION, HYPOTHETICAL TRADING DOES NOT INVOLVE FINANCIAL RISK, AND NO HYPOTHETICAL TRADING RECORD CAN COMPLETELY ACCOUNT FOR THE IMPACT OF FINANCIAL RISK IN ACTUAL TRADING. FOR EXAMPLE, THE ABILITY TO WITHSTAND LOSSES OR TO ADHERE TO A PARTICULAR TRADING PROGRAM IN SPITE OF TRADING LOSSES ARE MATERIAL POINTS WHICH CAN ALSO ADVERSELY AFFECT ACTUAL TRADING RESULTS. THERE ARE NUMEROUS OTHER FACTORS RELATED TO THE MARKETS IN GENERAL OR TO THE IMPLEMENTATION OF ANY SPECIFIC TRADING PROGRAM WHICH CANNOT BE FULLY ACCOUNTED FOR IN THE PREPARATION OF HYPOTHETICAL PERFORMANCE RESULTS AND ALL OF WHICH CAN ADVERSELY AFFECT ACTUAL TRADING RESULTS.