Fibonacci Retracements – What are they and more importantly how are they used in trading? They are a set of ratios derived from the Fibonacci sequence, which is a mathematical series that’s derived from the golden ratio (1.618033). It’s made up of the following pattern which generates a new number by adding the two previous numbers: 0, 1, 1, 2, 3, 5, 8, 13, 21, ad infinitum. The theory was named after a 13th century mathematician, Leonardo de Pisa, also known as Leonardo Fibonacci or Leonardo Bonacci.
In today’s short blog, we won’t get into the mathematics behind the ratios or even why they’re used–just know that traders do use them – this is how and why. Whether they are self-fulfilling (because traders use them) or they reflect something deeper with regard to price or market sentiment, what it boils down to is that Fib retracements make for a practical and “tactical” tool for plotting price entries and exits.
Below are some common “What if” scenarios that traders often can relate to:
- What if you need to exit your trade or move up your stop loss?
- What if you already have a position and are looking to add more to it?
- What if you are looking for a good “long” entry point?
- What if you are “short” the market and are looking for a price target?
For each of these scenarios, Fibonacci retracements might come in handy.
Three Critical “Fib” Levels
The five levels below are included in most Fib retracements tools.
- 23.6%
- 38.2%
- 50.0% (though not a mathematical Fib level, traders still use it)
- 61.8%
- 68.6%
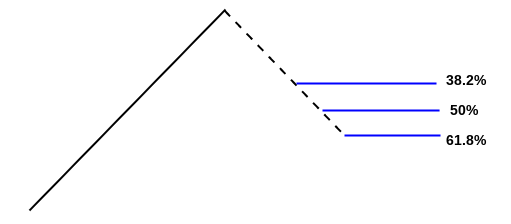
The most widely used levels are the middle three (in bold above): 38.2%, 50%, and 61.8%. Let’s expand of these.
The 38.2% Retracement
This first level is what most traders may view as the first pullback level. Anything less than this (e.g. 23.6%) might be considered a pullback minor enough to ignore.
- Those looking to add positions might consider this a tradeable level with the expectation that price may pull back even deeper.
The 50% Retracement
Please be aware that this is not really a Fibonacci ratio, but traders often find it useful, so it is typically included with the Fibonacci retracements. At the 50% line, those who bought at the beginning of the last swing and those who sold short at the top of the swing are holding a profit. It represents a balance point in which buyers and sellers may be in the green. It is a critical point, as only one position (the bulls or bears) will eventually occupy the favorable position.
- For those looking to buy or add to their position, the 50% level may represent a sound entry point.
- For those holding a short position, the 50% level may represent the first and most conservative price target to exit positions.
The 61.8% Retracement
If price retraces past the 61.8% level, then traders consider the possibility that the trend may discontinue or reverse. Of course, retracements have gone past this level, but it is common for strong trends to bounce back within the 61.8% “range” (higher or lower).
- For those looking to buy or add to their position, a bounce off the 61.8% level makes for a strong entry point.
- For those holding a short position, the 61.8% level may represent an ideal short-term target unless the trend reverses and heads toward the starting point of the trend (which is a different trading scenario altogether, one in which you may be using Fibonacci extensions, but that’s for another article).
There are several more Fibonacci-based trading concepts one can learn about, so this is really just the beginning. But even if your knowledge of Fibonacci tools is limited to Fib retracements, that can still come in handy.
Please be aware that the content of this blog is based upon the opinions and research of GFF Brokers and its staff and should not be treated as trade recommendations. There is a substantial risk of loss in trading futures, options and forex. Past performance is not necessarily indicative of future results.