You’re following a market that just tanked. You think you see a potential “bottoming” but you’re unsure. You also know common wisdom says to not try to time market bottoms (or tops for that matter). Yet, getting in close to the proverbial “ground floor” means greater return potential.
So, you decide that now’s the time to jump in. This is called “bottom fishing.” But how might you do it in such a way that reduces the risk of getting eaten by sharks? We have an idea, and that’s what we’re about to cover: a bottom fishing setup that might increase your return potential while mitigating your downside.
A Method for Picking Potential Bottoms
This method requires a specific market formation. Let’s lay it out in detail:
- There must be a “double bottom”
- The second bottom must be higher than the first–at least 20% the height of the formation from the low
Note that you can place stop losses* below either bottom. However, if you place your stop loss slightly below the second (higher) low, you run the risk of getting stopped out more frequently.
The Rationale Behind This Trade
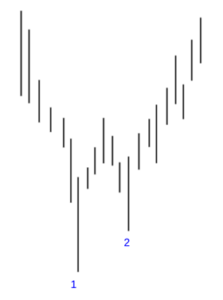
Here’s what we’re looking for: a market hits a low and bounces back. The market then “retests” the low but doesn’t quite sink to the previous low. Why not? Possibly because the number of sellers are thinning out while the volume of buyers may be increasing. This indicates the possibility of a trend reversal (from down to up), whether short-term or long term. The key to this trade is that second low and what it indicates.
Now here’s what it can look like:

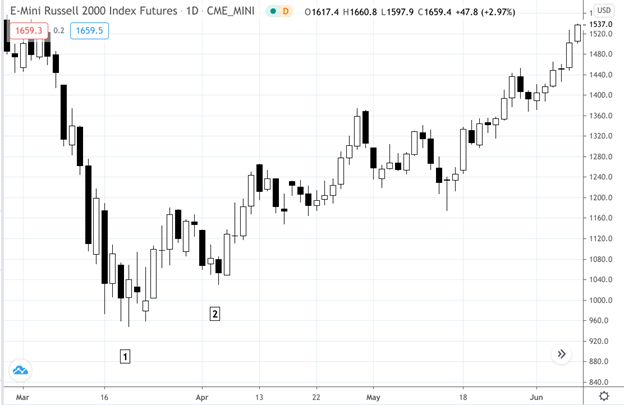
Very clear model. Sometimes, the live market gives you a clear formation:
E-Mini Russell 2000 – Daily Chart – February 27, 2020 to June 8, 2020
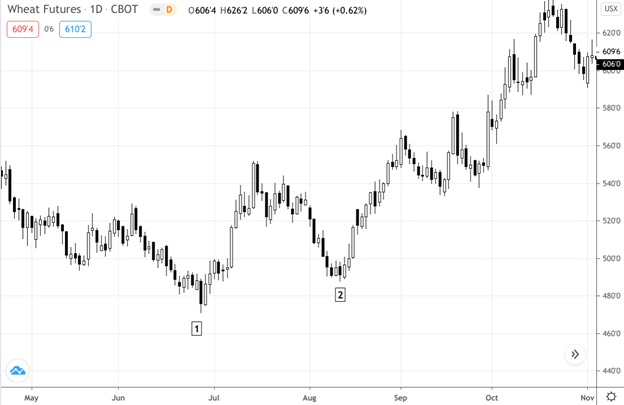
Other times, the formations can be messier, lasting several days between the two lows:
Wheat Futures – Daily – April 22, 2020 to November 3, 2020
Okay, so how do you trade them?
Setting Up Your Bottom Fishing Entry
Step 1: Find a double bottom wherein the second bottom is higher than the first
Let’s use our first example.
Again the important thing here is the second bottom. It indicates that buying pressure may be increasing while selling pressure is decreasing.
Step 2: Calculate the height of the chart and determine your price target
- [A] = the first low and the absolute bottom of the formation.
- [C] is the highest point of the formation.
- [B] is the second low.
Find the height of the formation by subtracting A from C.
Next, determine a “multiple” for your target based on this height (75%, 100% or more). Don’t forget to consider both the technical factors (such as overhead resistance) and fundamental factors when setting your price target. On the latter (fundamentals), remember that price is only a projection of fundamental expectations; in the end the fundamentals must validate the projected price (otherwise, price may fall).
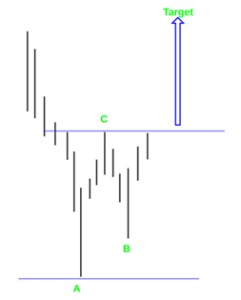
Take your preferred “multiple,” and add it to C. That will be your price target.
Step 3: Entry, profit and stop loss orders*
- Enter the trade once the asset price closes above [C].
- Once you’ve entered your position, place an order to sell at your target.
- Place a stop loss* at the bottom of your pattern [A].
- Alternatively, you can place a stop loss below [B], but be aware you may be stopped out more frequently than if you were to place a stop below [A] which, if violated, cancels out the pattern.
Step 4: Complete the Trade
The last part is pretty easy. Hopefully, you’re allocated the right percentage of risk to your position. That part is up to you (depending on how much you typically risk per trade).
If your target is 100% or more the height of the pattern, then you might even raise your stop loss* to [B], or place at a breakeven point to limit your losses.
Let’s take the Emini Russell 2000 futures market example above to see how this setup might have worked out.
Example – Emini Russell 2000 Trade
E-Mini Russell 2000 – Daily Chart – March 5, 2020 to July 14, 2020
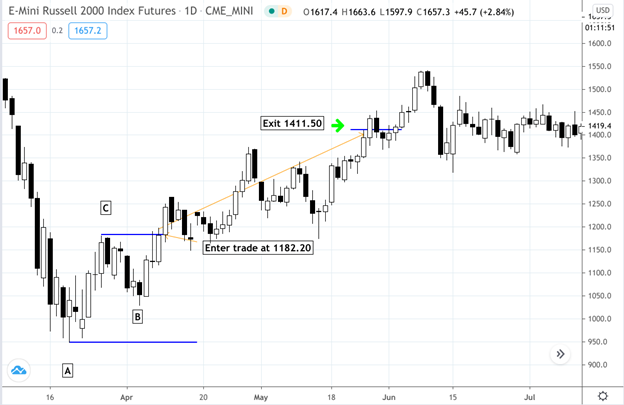
Let’s do a quick calculation:
- [C] = 1180.00
- [A] = 948.50
- Height of pattern (C-A) = 231.50
- [C] + 231.50 = 1411.50 (Target)
Price hit a low of 948.50 during the “coronavirus crash” in March 2020. Based on the uncertainties surrounding the pandemic as well as monetary and fiscal response, there was no way to tell whether this was the bottom, or whether [C] was just a temporary pullback poised for further downside.
The Russell retested its lows at [B] but failed to reach the low point at [A]. Are buyers jumping in? No way to tell. But the bottoming setup is present, So you might have taken it. The breakout candle closed above [C] at the price of 1182.20. Following that close, price moved up to 1411.50, the target price.
This example illustrates a successful trade. It doesn’t always work out this way. Sometimes price will keep moving downward. You may sustain several losses in a row by trying to time bottoms. That’s why you should always position size in accordance to a tolerable risk limit (1%, 2%, it’s up to you). What matters is not how often you pull off a successful trade, but how large your returns are relative to your losses.
The Bottom Line
Bottom fishing is an attempt to time the market. Traders are not always good at timing markets. Hence, it is extremely important to manage your risks and position size. But if you find yourself in a position where you firmly believe that a market is bottoming-out, then this is a setup to consider as it attempts to time bottoms objectively while simultaneously managing downside risks.
Please be aware that the content of this blog is based upon the opinions and research of GFF Brokers and its staff and should not be treated as trade recommendations. There is a substantial risk of loss in trading futures, options and forex. Past performance is not necessarily indicative of future results.
Be advised that there are instances in which stop losses may not trigger. In cases where the market is illiquid–either no buyers or no sellers–or in cases of electronic disruptions, stop losses can fail. And although stop losses can be considered a risk management (loss management) strategy, their function can never be completely guaranteed.
Disclaimer Regarding Hypothetical Performance Results: HYPOTHETICAL PERFORMANCE RESULTS HAVE MANY INHERENT LIMITATIONS, SOME OF WHICH ARE DESCRIBED BELOW. NO REPRESENTATION IS BEING MADE THAT ANY ACCOUNT WILL OR IS LIKELY TO ACHIEVE PROFITS OR LOSSES SIMILAR TO THOSE SHOWN. IN FACT, THERE ARE FREQUENTLY SHARP DIFFERENCES BETWEEN HYPOTHETICAL PERFORMANCE RESULTS AND THE ACTUAL RESULTS SUBSEQUENTLY ACHIEVED BY ANY PARTICULAR TRADING PROGRAM.
ONE OF THE LIMITATIONS OF HYPOTHETICAL PERFORMANCE RESULTS IS THAT THEY ARE GENERALLY PREPARED WITH THE BENEFIT OF HINDSIGHT. IN ADDITION, HYPOTHETICAL TRADING DOES NOT INVOLVE FINANCIAL RISK, AND NO HYPOTHETICAL TRADING RECORD CAN COMPLETELY ACCOUNT FOR THE IMPACT OF FINANCIAL RISK IN ACTUAL TRADING. FOR EXAMPLE, THE ABILITY TO WITHSTAND LOSSES OR TO ADHERE TO A PARTICULAR TRADING PROGRAM IN SPITE OF TRADING LOSSES ARE MATERIAL POINTS WHICH CAN ALSO ADVERSELY AFFECT ACTUAL TRADING RESULTS. THERE ARE NUMEROUS OTHER FACTORS RELATED TO THE MARKETS IN GENERAL OR TO THE IMPLEMENTATION OF ANY SPECIFIC TRADING PROGRAM WHICH CANNOT BE FULLY ACCOUNTED FOR IN THE PREPARATION OF HYPOTHETICAL PERFORMANCE RESULTS AND ALL OF WHICH CAN ADVERSELY AFFECT ACTUAL TRADING RESULTS.