We’ve all heard the saying “less is more.” This applies to pretty much everything, and it certainly applies to trading. But if less is indeed more, than more of what?
We can answer this question by first considering its inverse: “more is less.” The more complex the tool you use, the more time and effort it takes to set up. And when situations are rapidly unfolding, the more time it takes to setup your strategy, the less time you will have to react or to plan a well-thought response.
Depending on our trading methodology, we sometimes need to use indicators to help us read the charts. But if you’ve been trading for some time, you are probably also aware that the more indicators you use, the greater the potential to be stifled by multiple and sometimes conflicting chart interpretations.
So how can you simplify things when markets are unfolding rapidly, or when your indicators are conflicting (e.g. one says the trend is up while the other says that price is not trending; one indicates a bullish probability while the other indicates the opposite; etc.)?
One solution is to cut back on indicators (everything that lags or predicts) and instead pay attention to what’s happening now, starting with just the price. We will look at 10 basic price action principles: 5 in this blog post and 5 in our follow up Part II blog post.
One: Utilize Support and Resistance Levels
Soybeans (ZS continuous) June 13, 2018 to January 28, 2019
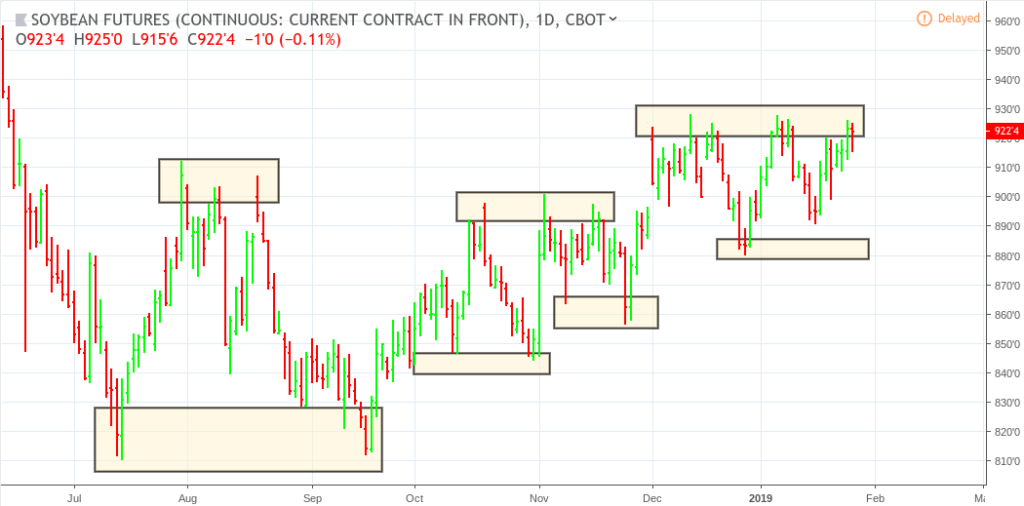
Support and resistance levels are critical in evaluating trends and selecting potential buy/sell areas. Just remember that a support or resistance level, even though it is marked by a swing high or low, can manifest itself as a “price range,” rather than a specific price.
Two: Analyze the Quality of the Swing Highs and Lows
E-Mini Down (YM continuous) February 27 to July 18, 2018
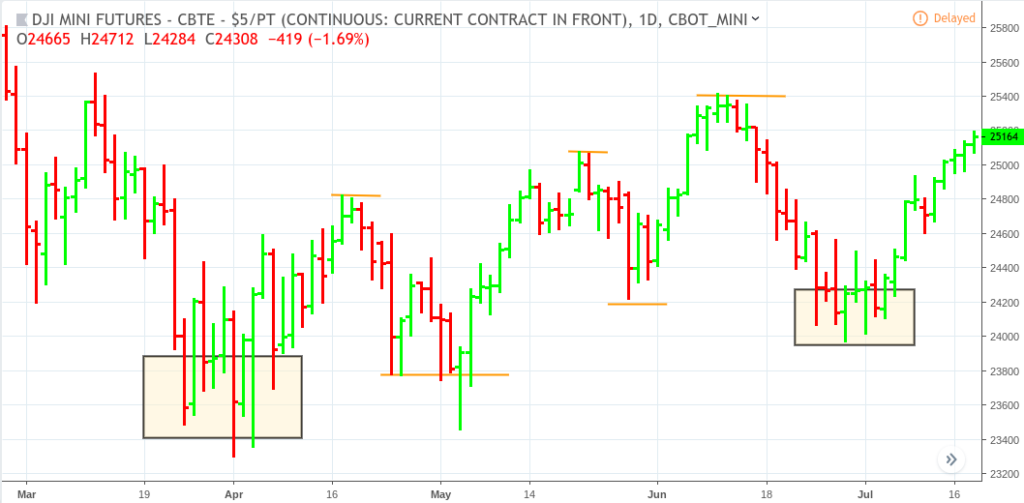
What’s the difference between the two support levels within the rectangle versus the support and resistance levels marked by the orange line? If you went short at the swing high point following the first support level in the rectangle, then hopefully you were anticipating the possibility of having to take profits quickly.
Why? When support and resistance levels show a “cluster” of trades, especially at high volume, there’s a possibility that those levels were highly contentious, a weightier struggle between bulls and bears, in which the buyers in this case won out. In other words, not all support and resistance levels are equal.
Three: Beware Small-Range Bars That Can Often Lead to Explosive Moves
Tilray stock (TLRY) from July 19 to September 19, 2018
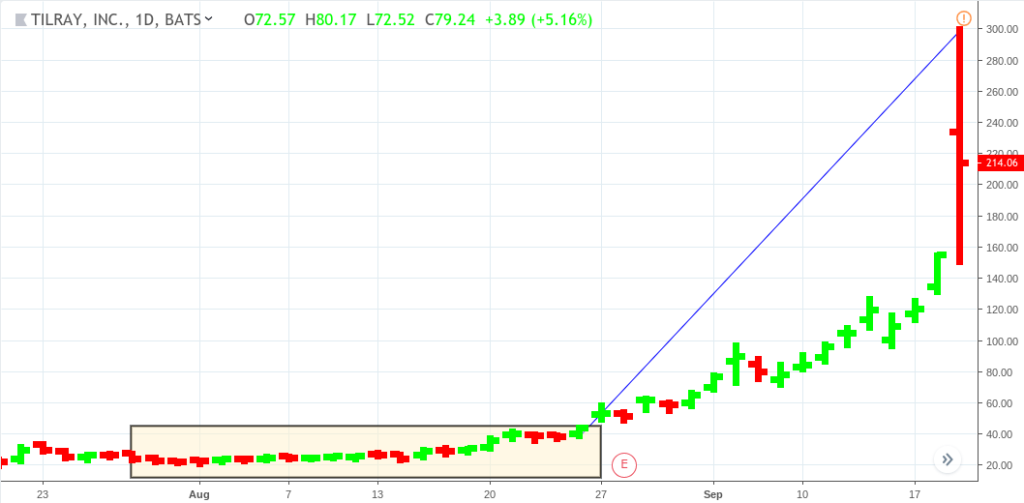
This event was fundamentally driven, causing a real price shock. Nevertheless, when an asset is trading in a narrow range with very little volatility, it can mean that traders are awaiting some fundamental event that may drive its price either way. In this case above, fundamentally-based buyers and technical traders started to jump in after the range breakout. What they were waiting for happened in the last bar of this chart, where price, originally at 44.00 at the top of the range, went as high as 300.00 in less than three weeks.
Four: Look Out for Wide Range Bars, Particularly in Areas of Support and Resistance
Palo Alto Networks (PANW) June 5 to Sept 11, 2018
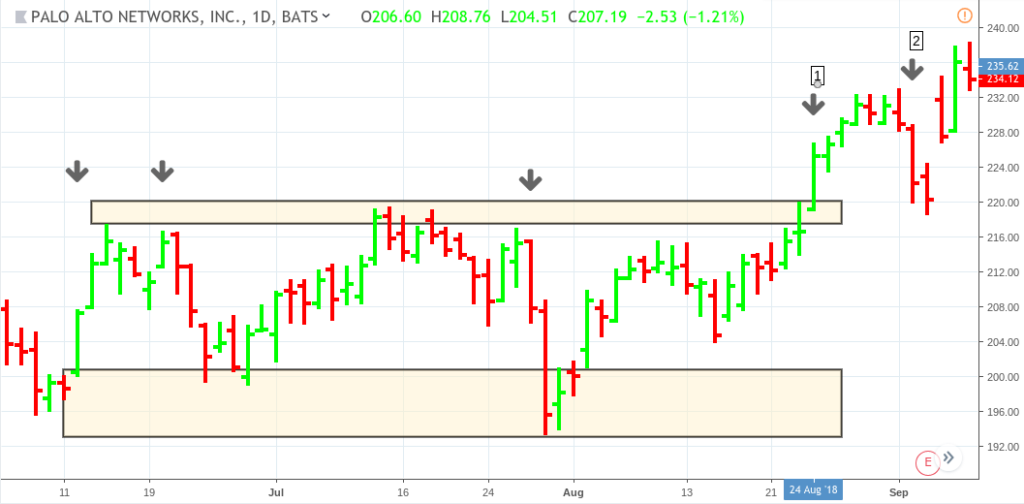
Take a look at the down arrows pointing to the bars within the trading range (support and resistance highlighted by the shaded boxes). Notice the strong buying and selling pressure within the range. In trading, one can NEVER be 100% certain, but this looks like range trading (buying and then selling short to seek profit within the range). Note that at (1) there was a wide bar breakout, which was then rejected at (2). By the looks of it, the trend direction was still undecided, indicating that it wasn’t about to make any definitive move up or down in the near term.
Five: Price Rejections Can Provide Critical Information
S&P 500 (ES continuous) Weekly chart – December 18, 2017 to January 28, 2019
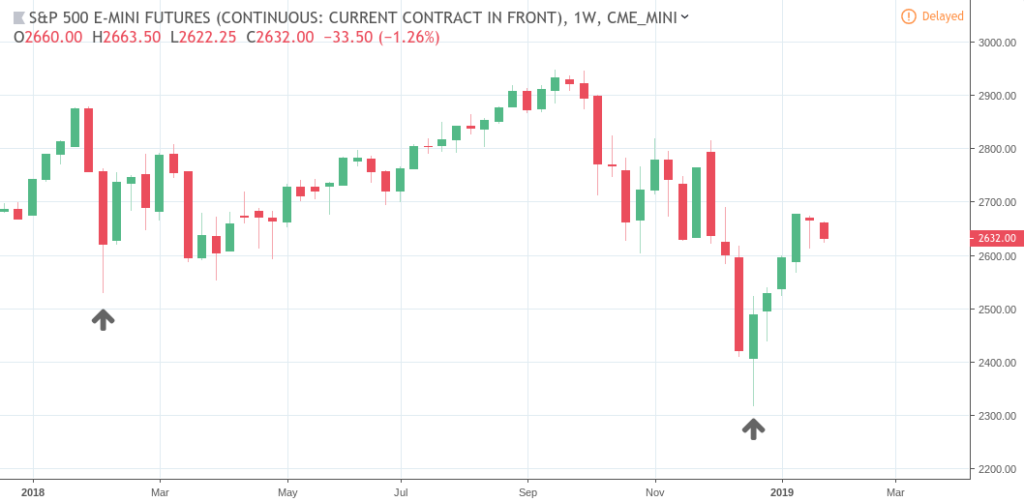
We’re looking at a longer term trend here that’s been happening recently, hence the weekly chart. Since the current bull market has been on most investors’ minds, especially with regard to the current trade war and the Fed’s quantitative tightening policy, let’s take a bigger picture here to see where investors (perhaps mostly institutional) came in droves to buy the S&P despite ongoing economic concerns.
This is best illustrated using candles rather than bars. Take a look at the candles above the two arrows. Notice the long tails, indicating that price reached the bottom of each tail but then was “rejected” by buyers who thought those price levels were “undervalued.” Next, take a look at the weekly price action thereafter. The main point is that rejected price levels can indicate important information with regard to where buyers (or sellers) have participated en masse. And we can assume that the larger the time frame, the more significant the rejection and what it may indicate.
Please be aware that the content of this blog is based upon the opinions and research of GFF Brokers and its staff and should not be treated as trade recommendations. There is a substantial risk of loss in trading futures, options and forex. Past performance is not necessarily indicative of future results.
Disclaimer Regarding Hypothetical Performance Results: HYPOTHETICAL PERFORMANCE RESULTS HAVE MANY INHERENT LIMITATIONS, SOME OF WHICH ARE DESCRIBED BELOW. NO REPRESENTATION IS BEING MADE THAT ANY ACCOUNT WILL OR IS LIKELY TO ACHIEVE PROFITS OR LOSSES SIMILAR TO THOSE SHOWN. IN FACT, THERE ARE FREQUENTLY SHARP DIFFERENCES BETWEEN HYPOTHETICAL PERFORMANCE RESULTS AND THE ACTUAL RESULTS SUBSEQUENTLY ACHIEVED BY ANY PARTICULAR TRADING PROGRAM.
ONE OF THE LIMITATIONS OF HYPOTHETICAL PERFORMANCE RESULTS IS THAT THEY ARE GENERALLY PREPARED WITH THE BENEFIT OF HINDSIGHT. IN ADDITION, HYPOTHETICAL TRADING DOES NOT INVOLVE FINANCIAL RISK, AND NO HYPOTHETICAL TRADING RECORD CAN COMPLETELY ACCOUNT FOR THE IMPACT OF FINANCIAL RISK IN ACTUAL TRADING. FOR EXAMPLE, THE ABILITY TO WITHSTAND LOSSES OR TO ADHERE TO A PARTICULAR TRADING PROGRAM IN SPITE OF TRADING LOSSES ARE MATERIAL POINTS WHICH CAN ALSO ADVERSELY AFFECT ACTUAL TRADING RESULTS. THERE ARE NUMEROUS OTHER FACTORS RELATED TO THE MARKETS IN GENERAL OR TO THE IMPLEMENTATION OF ANY SPECIFIC TRADING PROGRAM WHICH CANNOT BE FULLY ACCOUNTED FOR IN THE PREPARATION OF HYPOTHETICAL PERFORMANCE RESULTS AND ALL OF WHICH CAN ADVERSELY AFFECT ACTUAL TRADING RESULTS.