In the previous installment, we covered 5 of 10 price action principles that can help you simplify your approach to analyzing price charts without compromising the effectiveness of your analytical efforts (in some cases, it may add to its effectiveness).
Let’s complete our list by covering the last 5 principles:
Six – Pay Attention to Trading Gaps
Cann Trust Holdings (CNTTF) Daily chart from April 10 to July 31, 2018
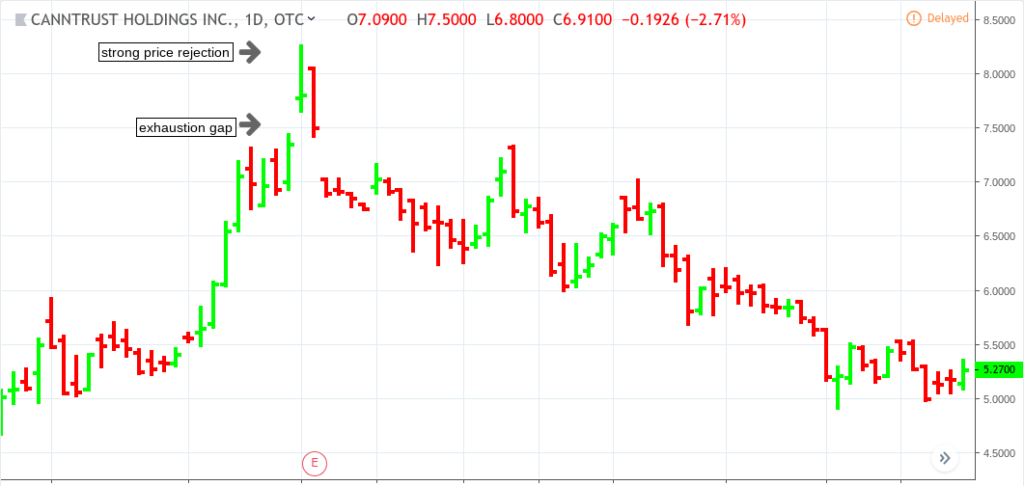
There are four general trading gap types: breakaway gaps, exhaustion gaps, continuation gaps, and common gaps. The chart above illustrates an exhaustion gap leading to a wide bar with a relatively deep price rejection (see previous post for details on price rejections). The topic of trading gaps is extensive enough to exceed the scope of this post, but it’s a topic which you might want to get more familiar with, as gaps can provide critical information depending on the context of the price action and the fundamentals surrounding them.
Seven – Measure Retracements Relative to the Price Swing You Are Following
Prices fluctuate up and down, sometimes appearing almost cyclical. If you’ve spent time observing this, you would also have noticed that there are smaller cycles within larger cycles, as there are micro-trends within larger trends (or non-trending movements as well). So it might be a good idea to know which price swing (or trend) you are following. Next, if you happen to be waiting for a retracement, you might want to view the retracement relative to the price swing you are following. Next question: what is a reasonable measure of retracement? This is where fibonacci measurements come in handy. We won’t get into it in depth, but typically a 50% retracement marks a significant point, as traders who are long from the start of the swing and short from the start of the retracement may be in a profitable position. If a retracement goes deeper than 78%, then traders who opened their positions at the beginning of the swing may end up dumping their positions as the retracement is indicating a potential reversal.
Wheat (ZW continuous) Daily chart from January 3 to April 9, 2018
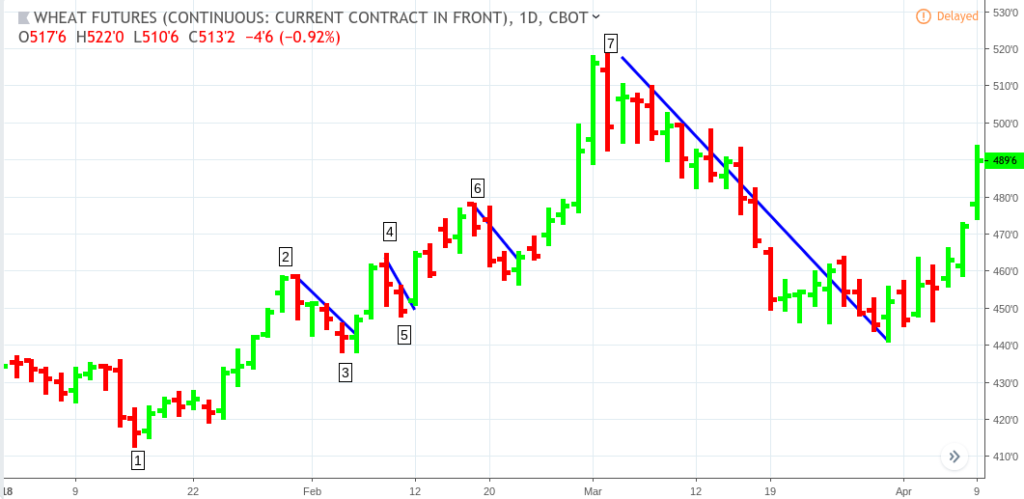
Let’s illustrate what we are talking about regarding both micro and macro price swings:
- (2) is a nearly a 50% retracement of (1);
- (4) is a 61.8% retracement of (3);
- (6) is a 63% retracement of (5); and
- (7) is a roughly a 76% retracement of (1).
Eight – Pay Attention to Consecutive Days Up or Down
If you’re looking for a price swing or a retracement to reverse, paying attention to consecutive days up or down can help. Despite popular opinion, however, there is no reliable “average” number of days indicating when a reversal may occur.
ZScaler (ZS) from August 21 to October 26, 2018
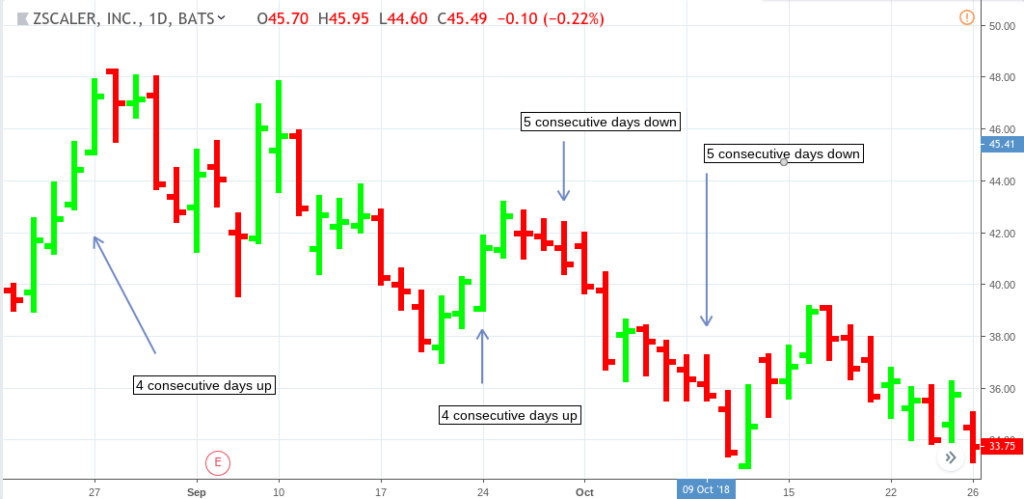
We’ve done our own analysis on this and found that the data varies too much to call any of it reliable, especially if your money is on the line. Just know that price fluctuates, and that if price has been moving up or down several days in a row, price may be bound to reverse. You’ll have to use other approaches to help you determine whether any price level may be a good entry point for a long or short trade. In other words, don’t just jump in because price has moved in one direction for x number of days.
Nine – Take a Big-Picture Look at Price and Trend
The difference between a local and global view can be immense. So follows the difference between a trend context in the short-term versus long-term.
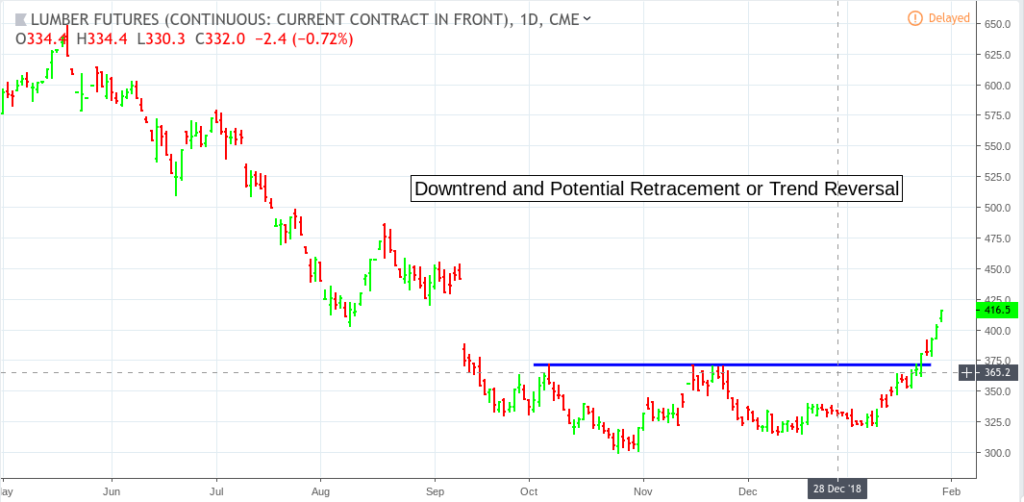
Lumber (LS continuous) Daily chart from October 4, 2018 to January 30, 2019
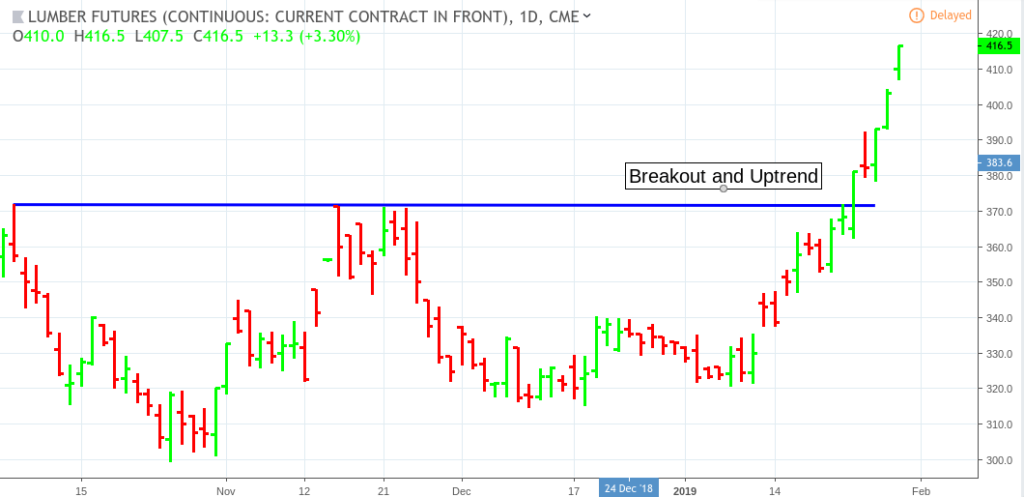
If you limit your view to the immediate context, you may lose the big picture…
Lumber (LS continuous) Daily chart from May 1, 2018 to January 30, 2019
Not only might the big picture provide potential price targets for you to consider, it might also change your initial near-term bias, particularly if you are a technical trader who does not follow the fundamentals of the industry.
Ten – Keep in Mind the Basic Principles of Trend Determination
Apple, Inc. (APPL) Daily chart from February 2, 2018 to January 30, 2019
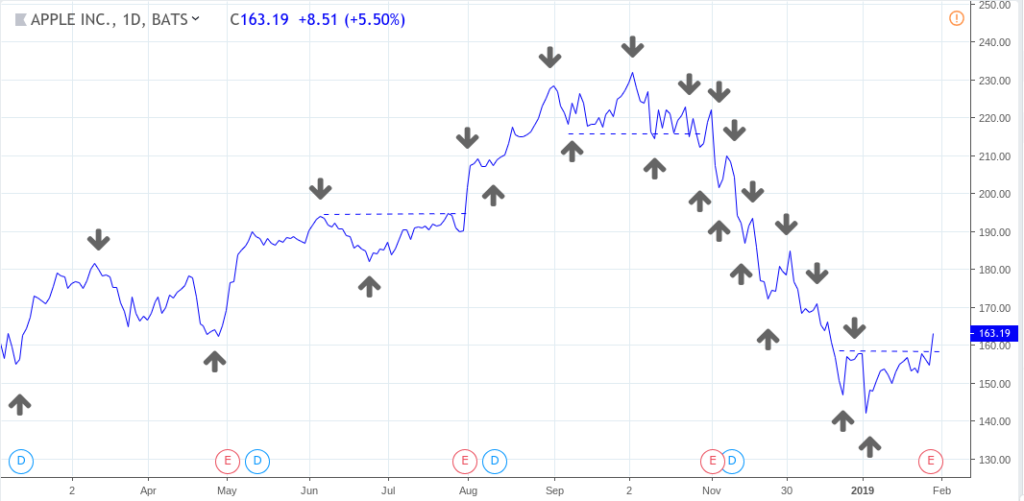
Although the basic principles of trend determination may be a bit more vague in real markets, they can serve as a strong “reference model” to which your analytical perspectives can adapt.
- Distinguish between the main trend of focus and micro- and macro-trends.
- Uptrend consists of consecutively higher highs and lows.
- Downtrend consists of consecutively lower lows and highs.
- Movements that do not follow this cycle often suggest potential sideways movements or potential trend changes or reversals.
Sometimes simplifying your analytical view can help you clear any clutter leading to indecision and to gain time for a more well-prepared market engagement.
Please be aware that the content of this blog is based upon the opinions and research of GFF Brokers and its staff and should not be treated as trade recommendations. There is a substantial risk of loss in trading futures, options and forex. Past performance is not necessarily indicative of future results.
Disclaimer Regarding Hypothetical Performance Results: HYPOTHETICAL PERFORMANCE RESULTS HAVE MANY INHERENT LIMITATIONS, SOME OF WHICH ARE DESCRIBED BELOW. NO REPRESENTATION IS BEING MADE THAT ANY ACCOUNT WILL OR IS LIKELY TO ACHIEVE PROFITS OR LOSSES SIMILAR TO THOSE SHOWN. IN FACT, THERE ARE FREQUENTLY SHARP DIFFERENCES BETWEEN HYPOTHETICAL PERFORMANCE RESULTS AND THE ACTUAL RESULTS SUBSEQUENTLY ACHIEVED BY ANY PARTICULAR TRADING PROGRAM.
ONE OF THE LIMITATIONS OF HYPOTHETICAL PERFORMANCE RESULTS IS THAT THEY ARE GENERALLY PREPARED WITH THE BENEFIT OF HINDSIGHT. IN ADDITION, HYPOTHETICAL TRADING DOES NOT INVOLVE FINANCIAL RISK, AND NO HYPOTHETICAL TRADING RECORD CAN COMPLETELY ACCOUNT FOR THE IMPACT OF FINANCIAL RISK IN ACTUAL TRADING. FOR EXAMPLE, THE ABILITY TO WITHSTAND LOSSES OR TO ADHERE TO A PARTICULAR TRADING PROGRAM IN SPITE OF TRADING LOSSES ARE MATERIAL POINTS WHICH CAN ALSO ADVERSELY AFFECT ACTUAL TRADING RESULTS. THERE ARE NUMEROUS OTHER FACTORS RELATED TO THE MARKETS IN GENERAL OR TO THE IMPLEMENTATION OF ANY SPECIFIC TRADING PROGRAM WHICH CANNOT BE FULLY ACCOUNTED FOR IN THE PREPARATION OF HYPOTHETICAL PERFORMANCE RESULTS AND ALL OF WHICH CAN ADVERSELY AFFECT ACTUAL TRADING RESULTS.